
Analysis of the VPP
dynamic network
constraint
management
Advanced VPP grid integration project
Lachlan O’Neil, Luke Reedman, Julio Braslavsky, Thomas
Brinsmead, Cathryn McDonald, Alex Ward and Bryn Williams
Revised 20 May 2021
Prepared for the ARENA Advanced VPP grid integration project led
by SA Power Networks in partnership with Tesla Motors Australia
and the CSIRO
Australia’s National
Science Agency
Analysis of the VPP dynamic network constraint management | i
CSIRO Energy
Energy Systems
Citation
O’Neil, L., Reedman, L., Braslavsky, J., Brinsmead, T., McDonald, C., Ward, A. and Williams, B.
(2020). Analysis of the VPP dynamic network constraint management – Advanced VPP grid
integration project. CSIRO, Australia
Copyright
© Commonwealth Scientific and Industrial Research Organisation 2020. To the extent permitted
by law, all rights are reserved and no part of this publication covered by copyright may be
reproduced or copied in any form or by any means except with the written permission of CSIRO.
Important disclaimer
CSIRO advises that the information contained in this publication comprises general statements
based on scientific research. The reader is advised and needs to be aware that such information
may be incomplete or unable to be used in any specific situation. No reliance or actions must
therefore be made on that information without seeking prior expert professional, scientific and
technical advice. To the extent permitted by law, CSIRO (including its employees and consultants)
excludes all liability to any person for any consequences, including but not limited to all losses,
damages, costs, expenses and any other compensation, arising directly or indirectly from using this
publication (in part or in whole) and any information or material contained in it.
CSIRO is committed to providing web accessible content wherever possible. If you are having
difficulties with accessing this document please contact [email protected].
Analysis of the VPP dynamic network constraint management | 1
Contents
Acknowledgments ........................................................................................................................... 6
Summary ............................................................................................................................... 7
Analysis scope and methods............................................................................................... 7
Findings: VPP export capacity under dynamic constraint management............................ 8
Findings: VPP released energy under dynamic constraint management........................... 9
Findings: Network hosting capacity .................................................................................... 9
Findings: Economics ............................................................................................................ 9
Main conclusion ................................................................................................................ 10
Opportunities for further work ......................................................................................... 11
1 Introduction ...................................................................................................................... 13
1.1 The need for dynamic network capacity allocation ............................................ 13
1.2 Scope and research objectives of the project ..................................................... 14
1.3 Scope and research objectives of the report ...................................................... 15
1.4 Organisation of the report................................................................................... 16
2 Management and representation of network capacity ................................................... 18
2.1 SAPN API system architecture ............................................................................. 18
2.2 The constraint engine .......................................................................................... 20
2.3 Representation of capacity constraints ............................................................... 26
2.4 Capacity metrics .................................................................................................. 28
2.5 Summary of capacity definitions and performance metrics ............................... 32
3 Analysis of VPP DER export capacity ................................................................................ 33
3.1 Context ................................................................................................................ 33
3.2 Seasonal variability of average available capacity .............................................. 34
3.3 Distribution of available capacity across the VPP ............................................... 36
3.4 Released energy .................................................................................................. 40
3.5 Summary of findings ............................................................................................ 43
4 Analysis of VPP DER hosting capacity ............................................................................... 45
4.1 Context ................................................................................................................ 45
4.2 Availability of DER export capacity ...................................................................... 46
4.3 Summary of findings ............................................................................................ 48

2 | CSIRO Australia’s National Science Agency
5 Analysis of VPP costs and benefits ................................................................................... 49
5.1 Overview .............................................................................................................. 49
5.2 Methodology ....................................................................................................... 49
5.3 Costs .................................................................................................................... 50
5.4 Benefits ................................................................................................................ 50
5.5 Net present value ................................................................................................ 56
5.7 Summary of findings ............................................................................................ 60
6 Conclusions and opportunities for further work .............................................................. 61
6.1 Conclusions .......................................................................................................... 61
6.2 Some reflections on further work ....................................................................... 62
............................................................................................................................. 65
References ............................................................................................................................. 73
Analysis of the VPP dynamic network constraint management | 3
Figures
Figure 1. Technical architecture of the system supporting the integration of the VPP into SAPN
network ......................................................................................................................................... 18
Figure 2. Constraint node mapping example ................................................................................ 19
Figure 3 - plotted for a random sample of nine transformers for a January non-workday
with a confidence margin of 80%. ............................................................................................ 22
Figure 4 - plotted for all 584 VPP sites for a January non-workday with a confidence margin
of 80%. ...................................................................................................................................... 23
Figure 5 - plotted for a random sample of nine TFs for a January non-workday with a
confidence margin m of 80%. ....................................................................................................... 24
Figure 6 - plotted for all 584 VPP sites for a January non-workday with a confidence margin
of 80%. ...................................................................................................................................... 25
Figure 7 - Trimmed constraints aggregated across all VPP sites (n=584) for a January non-
workday with a confidence margin of 80%. ................................................................................. 27
Figure 8 - Released energy shown as the area highlighted in orange on the constraint profile of
Figure 7.......................................................................................................................................... 30
Figure 9 - and pointed out explicitly for Figure 7 with the minimum of and
highlighted in green. ..................................................................................................................... 31
Figure 10 – The average available capacity for the aggregate of 584 VPP sites throughout the
year, calculated with confidence margin based on the day-type scenarios defined in
Table 1. The heatwave-day scenario is represented together with non-workdays in January
without implication that it could not occur at other times. ......................................................... 35
Figure 11 – The distribution whole day average available capacity across the ensemble
of VPP sites for both workdays and non-workdays during daylight hours with an 80% confidence
margin ........................................................................................................................................... 37
Figure 12 – The distribution likely average available capacity (additional capacity over
the 5 kW limit that can be allocated during daylight hours) across the ensemble of VPP sites for
both workdays and non-workdays during daylight hours with an 80% confidence margin ........ 37
Figure 13 – System capacity constraint seasons ........................................................................... 38
Figure 14 – The density of whole day average available capacity across the ensemble of
VPP sites for both workdays and non-workdays during daylight hours with an 80% confidence
margin ........................................................................................................................................... 38
Figure 15 - The density of likely average available capacity AC_(i,dl) (additional capacity over the
5 kW limit that can be allocated during daylight hours) across the ensemble of VPP sites for
both workdays and non-workdays during daylight hours with an 80% confidence margin ........ 39
4 | CSIRO Australia’s National Science Agency
Figure 16 – The percentage distribution of whole day average available capacity across
the ensemble of VPP transformers for both workdays and non-workdays during daylight hours
with an 80% confidence margin.................................................................................................... 39
Figure 17 – The percentage distribution of likely average available capacity (additional
capacity over the 5 kW limit that can be allocated during daylight hours) across the ensemble of
VPP transformers for both workdays and non-workdays during daylight hours with an 80%
confidence margin ........................................................................................................................ 40
Figure 18. The aggregate Released Energy for confidence margin of 80% for all sites under all
scenarios ....................................................................................................................................... 41
Figure 19 – The distribution of Released Energy across the ensemble of VPP sites for both
workdays and non-workdays during daylight hours with an 80% confidence margin................. 42
Figure 20 – The percentage distribution of Released Energy across the ensemble of VPP sites
for both workdays and non-workdays during daylight hours with an 80% confidence margin .. 43
Figure 21 – The summed available capacity across all 75,530 transformers in SAPN’s network
using a 0kW reference .................................................................................................................. 47
Figure 22: Summer day load profiles for customers in cluster one: SP_ResCust09, SP_ResCust17,
SP_ResCust25, SP_ResCust27, SP_ResCust43 .............................................................................. 52
Figure 23: Summer day load profiles for customer in cluster two: SP_ResCust06, SP_ResCust19,
SP_ResCust24, SP_ResCust36, SP_ResCust37, SP_ResCust38, SP_ResCust44 ............................. 53
Figure 24: Summer day load profiles for customer in cluster three: SP_ResCust02,
SP_ResCust05, SP_ResCust11, SP_ResCust16, SP_ResCust22, SP_ResCust34, SP_ResCust41 .... 53
Figure 25: Hourly solar PV output, 5kW system, Kent Town, Adelaide........................................ 54
Figure 26: Annual energy arbitrage benefits by participant and export limit case ...................... 56
Figure 27 - The solar curve defined based on Sunrise and Sunset times for a January non-
workday. ........................................................................................................................................ 66
Figure 28 – Site load profiles, peak Summer day.......................................................................... 67
Figure 29 – Site load profiles, peak winter day ............................................................................. 68
Analysis of the VPP dynamic network constraint management | 5
Tables
Table 1. The 25 scenarios covered by the constraint engine ....................................................... 20
Table 2 - The distribution of batteries across transformers - the number of batteries a
transformer is loaded with, and how many times that loading occurs within this sample ......... 25
Table 3 - A visual breakdown of each element of the capacity constraint representation in
Figure 7.......................................................................................................................................... 28
Table 4. The key metrics for the scenario shown in Figure 1. ...................................................... 31
Table 5 - A summary of the metrics defined throughout Section 2.2 and Section 3.2. ............... 32
Table 7 – Percentage of transformers with listed available capacity if they are to remain
unconstrained for 100% of the time. ............................................................................................ 48
Table 8: Registered capacities....................................................................................................... 51
Table 9: Monthly solar radiation and solar PV power production ............................................... 54
Table 10: Net present value (NPV) summary................................................................................ 56
Table 11: Net present value calculations, 2kW export limit case ................................................. 57
Table 12: Net present value calculations, 5kW export limit case ................................................. 58
Table 13: Net present value calculations, 10kW export limit case ............................................... 59
6 | CSIRO Australia’s National Science Agency
Acknowledgments
This Project received funding from ARENA as part of ARENA's Advancing Renewables Program.
The views expressed herein are not necessarily the views of the Australian Government, and the
Australian Government does not accept responsibility for any information or advice contained
herein.
Analysis of the VPP dynamic network constraint management | 7
Summary
This document is one of the knowledge-sharing deliverables of the Advanced VPP Grid Integration
project conducted by SA Power Networks in partnership with Tesla Motors Australia and the
CSIRO between January 2019 and December 2020. The project was enabled with funding by
ARENA.
The project demonstrated the capability to dynamically set network export limits for a virtual
power plant (VPP) coordinating the operation of an array of distributed energy resources (DER) –
rooftop PV systems with battery energy storage – allowing them to raise over the normal static
export limits during times and in locations where there is sufficient network capacity to do so. This
capability was tested on a field trial conducted in South Australia from July 2019 to December
2020, for which SA Power Networks and Tesla co-designed and implemented a network-VPP
application programming interface (API), operating procedures and rules to dynamically allocate
network capacity to the VPP. The network capacity information provided by the SAPN API was
used to coordinate the operation of the PV-battery systems at the first 1,000 customer premises
deployed as part of Tesla’s VPP rollout in SA.
This report presents research findings regarding the potential to increase DER exports beyond the
standard network static export capacity limit, provide flexibility to host increased numbers of DER
in the network, and release economic value to VPP aggregators.
Analysis scope and methods
The research was guided by a subset of the research questions formulated in the project research
plan [1] (See A.4). Namely,
RQ 1
To what extent can available DER export capacity be increased compared to the
maximum capacity available under SA Power Networks’ standard connection rules
(currently capped at 5kW export per customer) using dynamic network constraint
management via the proposed interface between SAPN and the DER aggregator?
RQ 3
To what extent can the proposed interface allow distribution networks to host DER at
higher levels of penetration by enabling dynamic, locational export limits compared to
standard fixed per-customer export limits?
RQ 5
What are the costs of implementing the proposed dynamic network constraint
management assessed against benefits obtained?
RQ 6
What additional economic value can be enabled to DER operators by dynamic network?
8 | CSIRO Australia’s National Science Agency
Additional analysis addressing the remaining research questions in [1], which deal with
management of DER operation within the network technical envelope, DER visibility and customer
impacts, will be addressed in a final knowledge sharing report at the end of the project.
The analysis underlying RQ1 and RQ3 was developed using dynamic capacity modelling data
provided to CSIRO by SAPN. A suite of metrics was defined to evaluate and compare DER
operation limits and export capacity under the dynamic constraint management approach
proposed by SAPN. The constraint modelling data provided by SAPN consisted of 25 different
scenarios categorised by day-type and month of the year. Each scenario specifies constraints over
a 24-hour period produced in half-hourly intervals for workdays and non-workdays for each month
of the year. A special profile for a heatwave-day scenario is also included.
This analysis did not study the accuracy or performance of the dynamic capacity models developed
by SAPN, which were taken as the source of truth for the analysis, nor did it consider actual VPP
utilisation of released capacity during the trial.
For RQ5 and RQ6, a preliminary economic analysis was conducted using simulated data provided
by Tesla to produce general estimates on value released by the dynamic network capacity
constraints approach implemented in the trial. This analysis focused on estimated wholesale
energy arbitrage benefits.
Findings: VPP export capacity under dynamic constraint management
The analysis of the dynamic capacity profiles modelled by SAPN indicates that dynamic constraint
management can support significant increases in average DER export capacity as compared to that
available under the standard static limit of 5 kW.
The analysis evaluated increases in export capacity averaged over two time periods: over a whole
day (daily) and over the portion of the day where PV generation is active (daylight-hours). It was
found that dynamic constraint management can support across the year:
• A 60% increase in daily average DER export capacity (up to 8 kW).
• A 20% increase in daylight-hour average DER export capacity (up to 6 kW).
Average available capacity is seasonal and achieves its highest values in the winter months, during
which dynamic constraint management can support:
• A 100% increase in daily average DER export capacity (up to 10 kW).
• A 60 % increase in daylight-hour average DER export capacity (up to 8 kW).
Average available capacity is also locational, varying across the transformers connected to the VPP
depending on where they are located. The analysis found that:
• All transformers connected to the VPP can be allocated the maximum increases in DER
export capacity from May to August.
• Half of the transformers connected to the VPP can be allocated the maximum increases in
DER export capacity from March to August.
• Fewer than 20% of the transformers connected to the VPP can be allocated the maximum
increases in DER export capacity across the year.
Analysis of the VPP dynamic network constraint management | 9
Findings: VPP released energy under dynamic constraint management
The estimated energy that can be released to the VPP through dynamic constraint management
follows similar variability across the year to that observed for average available capacity. The
analysis found that:
• During June and July, 90% of the VPP transformers are estimated to be able to release an
average 32.5 kWh per transformer per day on workdays; and 80% of the transformers on
non-workdays.
• The highest potential released energy levels are observed on heatwave days, when 45% of
the VPP transformers are estimated to release an average 45 kWh per transformer per day.
• The second highest potential release energy levels are observed from September to
February, when 12% of the VPP transformers are estimated to able to release an average
41 kWh per transformer per day.
Findings: Network hosting capacity
The analysis of the network capacity constraint estimates modelled by SAPN reveals that DER
hosting capacity could be increased significantly by enabling dynamic, locational export limits
rather than standard static constraint limits. As a basis for comparison, the analysis estimated that
a regime of static locational export limits across the network enables up to 200 MW of DER export
capacity, which could be allocated to DER allowed to export the maximum capacity allocated by
their static locational limit all the time across the year. This DER export capacity could be
increased for dynamically managed DER, which are able to be constrained at periods of high
network utilisation – typically during periods of low demand and high PV generation. The analysis
shows that by enabling a regime of dynamic locational export limits, DER export capacity could be
further increased by up to:
• 25% for dynamically managed DER exports that would be unconstrained 90% of the time
across the year,
• 55% for dynamically managed DER exports that would be unconstrained 80% of the time
across the year,
• 300% for dynamically managed DER exports that would be unconstrained 50% of the time
across the year.
Dynamic locational network limits, as implemented in the proposed SAPN API, can thus help
unlock otherwise unused network hosting capacity and increase utilisation of existing
infrastructure.
Findings: Economics
A preliminary economic analysis of the benefits of the approach was conducted using simulated
customer load profiles and solar PV output for 1,000 simulated customer premises, the targeted
deployment in Tesla’s VPP rollout in SA with the number of premises remaining constant for the
analysis period of 10 years.

10 | CSIRO Australia’s National Science Agency
The estimated benefits were simulated for three cases:
• 2 kW static network export limits,
• 5 kW static network export limits, and
• 10 kW static network export limits.
All three cases analysed used static limits to estimate the upper and lower bounds of potential
value in the implementation of an API to exchange real-time and locational data on distribution
network constraints between SA Power Networks and the customers’ DER aggregator (VPP
provider). Further analysis should incorporate the value of dynamic limits between these static
limits varying through time based on historic market data and sampled VPP performance.
The present economic modelling analysis found that the estimated wholesale energy arbitrage
benefits for each of the twenty participants across the three cases are nonlinear with export limit,
increasing the most when the export limit is 5 kW compared to 2 kW. Average energy arbitrage
benefits per site equalled $164 in the 2-kW case, $388 in the 5kW case and $423 in the 10kW case.
Increasing dynamic export limit from 2 kW to 5 kW has the potential to create up to $1.7 million
additional value to the 1000 participants in the VPP. Increasing the dynamic export limit from
2 kW to 10 kW has the potential to create up to $1.95 million additional value to the 1000
participants in the VPP.
These are preliminary findings based on the data available. A more detailed cost benefit analysis
should include dynamic export limits (rather than the static limits assumed here) and FCAS
revenues in benefit calculations. An estimate of ongoing costs of VPP implementation will also
need to be estimated.
Main conclusion
While further analysis of trial data will be conducted at the end of the field trial to expand on RQ 5
and RQ 6 and address the remaining research questions in [1], the findings of analysis reported at
this stage strongly support the main underlying hypotheses of the project.
H 1
Existing limits on the level of network exports from customers’ renewable energy
systems on the SA distribution network can be increased by as much as two-fold by
implementing an API to exchange real-time and locational data on distribution network
constraints between SA Power Networks and the customers’ DER aggregator (VPP
provider).
H 2
Operating a VPP at higher levels of export power than would otherwise be allowed
under normal static per-site export limits increases the opportunity for the VPP to
provide market and system-wide benefits.
Important caveats
1. The extent to which DER export capacity can be increased depends on the DER location
and the time of the day. The analysis shows that DER export capacity could indeed reach
Analysis of the VPP dynamic network constraint management | 11
at times in some network locations up to 10 kW, which is twice the DER export capacity
allowed by the current static export limit of 5 kW in SAPN network. However, this does not
imply that the network DER export capacity can be generally doubled by implementing a
regime of dynamic export limits.
2. The way DER export capacity is mapped and communicated is important.
Communicating available DER export capacity as a simple daily average can be misleading,
particularly for PV exports, since the data analysis shows that DER export capacity is
typically the lowest during daylight hours in networks with high PV penetration. Network
capacity available for PV exports is more accurately represented as a daylight average, and
even more so if maximum and minimum values are also captured alongside.
3. The findings from the analysis of DER export capacity and network DER hosting capacity
take the hosting capacity modelling data provided by SAPN as the source of truth. Hence,
the numerical results of the analysis should be taken as more as qualitative indicators of
what is possible, rather than as hard estimates. More confident estimates for hosting
capacity could be refined and validated with more data and improved modelling. Greater
uncertainty in the estimation of hosting capacity leads to more guarded release of value for
DER services in VPPs.
Opportunities for further work
Opportunities for additional research can be summarised as technical due diligence and
improvement, stakeholder consensus, and economic analysis.
Technical due diligence and improvements
The analysis reported for RQ 1 and RQ 3 was based on dynamic capacity constraint profiles
estimated by SAPN constraint engine. At this stage, these profiles provide an average daily
capacity curve per month of the year based on approximate hosting capacity estimates
extrapolated from calculations from a reduced sample of prototype feeder models and a small
number of tuneable parameters (see, e.g., [2]). Access to more DER and network data, such as that
provided by a VPP, can help clean network data and validate and refine models that underly the
hosting capacity assessment process, increasing confidence and reducing conservativeness in the
definition of safe operational envelopes. A combination of data-driven and physics-based state
estimation techniques could be considered for sections of the network where more connectivity
information, smart meter data, and monitored data become available.
Stakeholder consensus
Regarding stakeholder consensus, there is yet no Australian standard or industry-agreed upon
approach for calculating hosting capacity, but much foundational work has been done by EPRI
[16], [17], and there is ongoing work led by DEIP [13], [18]. Having one would create a number of
benefits, including consistency for VPP developers and clear guidance about how DNSPs should
communicate these limits to their customers.
12 | CSIRO Australia’s National Science Agency
Another opportunity for consensus exists regarding the definition of average available capacity.
This report highlighted the ability to describe this capacity on either a 24-hour or daylight-focused
basis. Our analysis indicates that, so long as solar energy is a major source of export, the daylight-
based metric is significantly more representative of the exploitable capacity, and should therefore
be the preferred way of communicating average impacts of dynamic hosting capacity limits. A
commonly agreed upon approach for communicating this information would be valuable.
Economic analysis
Finally, there is significant room for follow-up work on economic analysis. The present analysis
focused on the increased value to the VPP of implementing hosting capacity estimates at various
static levels for DER exports. This analysis is wholly distinct from an economic analysis of the
benefit of implementing dynamic constraint limits across SAPN’s service area. Indeed, one insight
from our analysis is that a large benefit of the introduction of dynamic operating envelopes is that
it can potentially optimise utilisation of hosting capacity across the network, enabling additional
customers to connect solar to the network. Future economic analysis could analyse this benefit in
addition to that released to the existing Tesla VPPs.
A more detailed cost-benefit analysis should include dynamic export limits (rather than static
limits assumed in the present report) based on observations collected from the trial and the
inclusion of FCAS revenues in benefit calculations (a recent report from AEMO [4] provides some
insights on VPP revenue from contingency FCAS markets in current VPP demonstrations, including
the present trial). More work is required to determine an accurate cost for the VPP integration
process. The PV-battery systems used in the trial were not optimised for dynamic limits, which
limited the potential upside versus the 5-kW static limit. As discussed above, consensus on the
best data and modelling techniques for adequately determining dynamic capacity limits need to
be identified and then the cost of collecting, cleaning, and analysing that data and then
communicating it to VPPs (or other DER) can be accurately determined. The economic upside is
also heavily dependent on proprietary optimisation algorithms that will vary greatly between VPP
operators.
Analysis of the VPP dynamic network constraint management | 13
1 Introduction
1.1 The need for dynamic network capacity allocation
Virtual Power Plants (VPPs) that aggregate many customers’ individual distributed energy
resources (DERs) under central control have great potential as a part of Australia’s energy mix.
VPPs enable new value streams for individual customers and, having the ability to respond rapidly
to export or consume large amounts of power, can potentially play a key role in balancing an
energy system dominated by intermittent renewables. However, VPPs also present challenges in
grid integration because the physical capacity to accommodate local energy peaks associated with
VPP operation in the low voltage network is limited.
In order to protect the integrity of the network for all customers, networks consider worst-case
event scenarios and set static export limits at each connection point to ensure that such events
will not cause local failures. For a VPP this means that the maximum power that the VPP can
manage as a whole is capped. Recent modelling by SA Power Networks suggests that these static
limits will likely need to be reduced in some areas to protect the network as DER penetration
grows, particularly if there is widespread enrolment of household DER in VPPs.
While AS/NZS4777 standards for inverter-connected DER [3] introduce advanced functionalities to
support LV distribution systems, such as Volt-Watt and Volt-VAR control functions, those
standards are not a panacea for managing a LV system with high penetrations of DER. One issue
with them is that over-voltage protection settings across the network are likely to be inconsistent
– in older inverters (installed under AS/NZS4777:2005), it has been observed that over-voltage
settings have been overridden by installers in some cases. Furthermore, consumers experience
different voltages depending on where they are connected within the network; customers close to
transformers are much more likely to have inverters trip than customers at the end of the same
line, even if they produce exactly the same amount of solar at the exact same times and their
consumption patterns are likewise identical.
If networks had a means to set export limits dynamically, according to the local conditions of the
network at a point in time, then greater export capacity could be made available at times when
the network assets are lightly loaded, increasing the opportunity of the VPP to be dispatched for
market benefits. Such dynamic export limits are a key capability for a Distribution Network Service
Provider (DNSP) in an energy system dominated by distributed generation, as it enables better
utilisation of the available distribution network capacity for generation without compromising
security of supply.
These issues are being tested in SA at an unprecedented scale. Tesla and the SA Government
announced plans to roll out battery storage and solar PV to up to 50,000 customers between 2018
and 2022. By 2022, the Tesla VPP could reach up to 500 MW of capacity, making it by far the
largest VPP in the world, and a very significant resource in South Australia’s energy market. The
first phase of this VPP encompassed 100 systems and has been completed. The second phase
involves the targeted 1,000 Housing Trust properties that constitute the Tesla VPP trial in the
present project. This trial has accelerated the development and real-world implementation of

14 | CSIRO Australia’s National Science Agency
advanced technologies co-designed by SAPN and Tesla to integrate a VPP in a network under
dynamic constraint management.
1.2 Scope and research objectives of the project
The Advanced VPP Grid Integration project aimed to demonstrate the capability to dynamically set
network export limits for DER, allowing them to raise over the normal static export limits during
times and in locations where sufficient network capacity to do so is available.
This capability has been tested on a field trial that operated in SA during one complete season
from July 2019 to July 2020, for which SAPN and Tesla co-designed and implemented a digital
communications interface – referred to as SAPN API (application programming interface) – to
manage the information exchange between the network and the VPP, as well as operating
procedures and rules to dynamically allocate network capacity.
The trial had 552 VPP sites registered by September 2019, 783 by December 2019 and 893 by
February 2020. The full trial will enable the solution to operate with the first 1,000 VPP sites of
the Tesla VPP rollout in SA. The analysis reported in this document is based on data for 584
VPP sites spread across 425 transformers. (Three-hundred fourteen (314 or 74% of all
analysed) transformers were connected to a single VPP customer.)
The collection and subsequent analysis of data collected during the execution of the project aimed
to test the following main underlying hypotheses:
H 1
Existing limits on the level of network exports from customers’ renewable energy systems
on the SA distribution network can be increased by as much as two-fold by implementing
an API to exchange real-time and locational data on distribution network constraints
between SA Power Networks and the customers’ DER aggregator (VPP provider).
H 2
Operating a VPP at higher levels of export power than would otherwise be allowed under
normal static per-site export limits increases the opportunity for the VPP to provide
market and system-wide benefits.
Eight research questions were formulated in the project research plan [1] to guide the generation
of new knowledge on technical, economic and social aspects of VPP grid integration by the
proposed dynamic network capacity management approach:
Management of DER hosting capacity
RQ 1. To what extent can available DER export capacity be increased compared to the maximum
capacity available under SA Power Networks’ standard connection rules (currently capped
at 5kW export per customer) using dynamic network constraint management via the
proposed interface between SAPN and the DER aggregator?
RQ 2. To what extent can the proposed interface support maintaining DER operation within the
technical envelope of the distribution network during times when network is highly utilised
(peak solar PV periods), or during unplanned capacity constraints (e.g. network faults or
system-wide contingencies)?

Analysis of the VPP dynamic network constraint management | 15
RQ 3. To what extent can the proposed interface allow distribution networks to host DER at
higher levels of penetration by enabling dynamic, locational export limits compared to
standard fixed per-customer export limits?
Visibility
RQ 4. To what extent can the proposed interface securely increase the visibility and management
of DER to network service providers?
Economics
RQ 5. What are the costs of implementing the proposed dynamic network constraint
management assessed against benefits obtained?
RQ 6. What additional economic value can be enabled to DER operators by dynamic network
constraint management, through enabling higher utilisation of existing network capacity?
Customer impacts
RQ 7. To what extent might the proposed dynamic hosting capacity regime impact on customers
and their take-up of demand management and third-party DER control?
RQ 8. What are the customer impacts, if any, of the dynamic network capacity management
approach?
1.3 Scope and research objectives of the report
The research presented in this report focused on the following four guiding research questions
dealing with management of network DER hosting capacity and economics of DER integration.
These four research questions are a subset of the eight guiding research questions for the project.
The remaining four research questions, dealing with technical limits of DER operation, DER
visibility, and customer impacts will be addressed in the final knowledge sharing report at the
conclusion of the project.
Management of DER hosting capacity
RQ 1
To what extent can available DER export capacity be increased compared to the
maximum capacity available under SA Power Networks’ standard connection
rules (currently capped at 5-kW export per customer) using dynamic network
constraint management via the proposed interface between SAPN and the DER
aggregator?
Scope: This research question is addressed by analysing dynamic capacity
estimates modelled by SAPN for 425 transformers connected to the VPP. These
capacity estimates were considered as the source of truth to evaluate the
potential to increase DER export capacity beyond the SAPN’s standard static
limits. The analysis did not assess the VPP utilisation of released capacity, nor the
performance of the capacity estimates provided.

16 | CSIRO Australia’s National Science Agency
RQ 3
To what extent could the proposed interface allow distribution networks to host
DER at higher levels of penetration by enabling dynamic, locational export limits
compared to standard static per-customer export limits?
Scope: This research question is addressed by analysing dynamic capacity
estimates modelled by SAPN for 75,530 transformers in their network. The
analysis assumes the proposed interface provides a safe and reliable approach for
managing the network and DER exports. As for RQ 1, these capacity estimates
were considered as the source of truth to evaluate the network potential to
increase DER hosting capacity by enabling dynamic, locational export limits. No
monitored trial data was used in this analysis.
Economics
RQ 5
What are the costs of implementing the proposed dynamic network constraint
management assessed against benefits obtained?
RQ 6
What additional economic value can be enabled to DER operators by dynamic
network constraint management, through enabling higher utilisation of existing
network capacity?
Scope: These research questions are addressed in a preliminary economic
analysis conducted using simulated customer load profiles and solar PV output
for 1,000 simulated customer premises remaining constant for the analysis period
of 10 years. The estimated benefits were simulated for energy market benefits
for three cases of static network export limits: 2 kW, 5 kW and 10 kW. No
monitored trial data was used in this analysis, and there is no analysis or inclusion
of the cost to provide a constraint management technology.
1.4 Organisation of the report
The rest of the report is organised as follows. A description of the dynamic capacity management
system implemented to support the integration of the VPP into the SAPN network is presented in
Section 2. The section outlines the main functionalities of the SAPN API – the core technical
component of the system – and describes the constraint engine that estimates the dynamic
network capacity information communicated to the VPP via the SAPN API. The section introduces
key concepts and metrics required to represent and analyse dynamic capacity constraints.
Section 3 presents analysis and research findings addressing RQ 1. The analysis explores the
potential to increase VPP DER export capacity limits that can be enabled by the proposed dynamic
constraint management approach.
Section 4 presents analysis and research findings addressing RQ 3. The analysis explores the
potential to increase VPP hosting capacity by the proposed dynamic constraint management
approach if implemented across SAPN network.
Analysis of the VPP dynamic network constraint management | 17
Section 5 presents a preliminary economic analysis and findings addressing RQ 5 and RQ 6. This
section focuses on the benefits of developing and implementing the proposed dynamic network
constraint management using the actual costs of implementation, the method used to calculate
the wholesale energy market benefits of VPP operation, and the key inputs used in the model
adopted. Costs for the analysis are solely based on an audited representation letter provided by
SAPN. This cost was assumed to be upfront in the first year of the trial, without ongoing costs.
With the limited data made available at the time for analysis, the findings reported provide only
general estimates for the benefits to the VPP operator, net present value and benefit-cost ratio
based on energy market benefits obtained in three cases of static –not dynamic – DER export
limits. Benefits arising from participation of the VPP in FCAS markets can be found in [4]
Section 6 presents the report conclusions and discusses opportunities for further work.

18 | CSIRO Australia’s National Science Agency
2 Management and representation of network
capacity
2.1 SAPN API system architecture
The architecture of the system that supports the integration of the VPP into the SAPN network is
illustrated in Figure 1. The core technical component of the system is the SAPN API, a co-designed
communications bridge between SAPN and Tesla backend information systems.
Figure 1. Technical architecture of the system supporting the integration of the VPP into SAPN network
A detailed description of APN API implementation may be found in the report [5]. The main
functions of the API are outlined as follows:
• DER registration
All DER devices are registered electronically with SAPN through the Tesla aggregated
platform. This registration message must inform SAPN the location, capabilities and control
affiliations of the DER, such as its participation in a VPP scheme or responding to any
external control signals. The DER registration is expressed with a unique ID assigned to the
VPP when they register with SAPN.
• DER monitoring
The API provides a stream of interval DER monitoring data which updates every 5 minutes.
This data includes:
• Site real power – 5-minute average, minimum and maximum
• Battery terminal voltage – 5-minute average, minimum and maximum
• Battery State of charge – instantaneous
SAPN WebAppDER database
Time-series
database
Constraints
management
Tesla WebApp
Tesla backend
systems
Tesla home battery systems
SAPN API
Registration
Monitoring
Limits
SAPN backend systems
Tesla backend systems
SAPN WebAppDER database
Time-series
database
Constraints
management
Registration
Monitoring
Limits

Analysis of the VPP dynamic network constraint management | 19
The API is set up in such a way that if required it could accommodate a range of different
data types, which could vary both in sampling interval (e.g. 30 minutes or 5 minutes) and
frequency of upload (e.g. once daily, or continuous updates at the sample rate).
• Constraint management
This part of the API provides dynamic network capacity information to the VPP in the form
of forecast export capacity limits, which define DER operating envelopes at nodal
aggregate level. In the event that the VPP system is unable to communicate with the API, it
will revert to a default export limit configuration commensurate with normal static limits.
• Constraint nodes
The concept of constraint nodes is used to manage groups of DER devices that are
connected to a common node on the distribution network that may be subject to a
capacity constraint, e.g., a distribution transformer. DER devices can be connected from
one to many constraint nodes depending on the nature of the section of network to which
they are connected. At a minimum, a DER will be mapped to a single constraint node which
is the transmission system connection point to which they are connected.
Aggregators of DER may benefit from understanding network limits at the constraint node,
rather than individual site, as it potentially gives greater scope for the aggregator to
optimise VPP operation. The intention is that the API will support both site-level and node-
level limits. The mapping may be expressed using constraint node IDs that are assigned to
DER devices.
The constraint status of a section of network can change in time and DER devices can be
moved to different nodes due to network reconfiguration. A new mapping must be
requested at regular intervals to ensure it is up to date.
Figure 2. Constraint node mapping example
Constraint
node 1
Constraint
node 2
DER
device 1
DER
device 2
Unconstrained
node
DER
device 3
DER
device 4

20 | CSIRO Australia’s National Science Agency
2.2 The constraint engine
Calculating dynamic site export limits
Identifying and communicating the distribution network constraints is essential to support
effective coordination of DER services to the network at large while maintaining the integrity of
the distribution network. Network constraints defined by voltage and thermal limits can be used
to define permissible DER services within the technical envelope of operation of the distribution
network [6].
In order to manage the export capacities made available to the VPP, SAPN have designed a
constraint management system (see the schematic in Figure 1), the core component of which is a
constraint engine that estimates the latent network capacity that can be made available to each
VPP site at any given time. This constraint engine produces a per-customer time series of export
constraint limits between 5 kW and 10 kW that are communicated to the VPP via the SAPN API.
The constraint engine is based on a prototypical network modelling approach, where detailed
modelling and monitoring of a small subset of representative network sections are used to
estimate the hosting capacity of the entire network. Such a prototypical modelling approach has
been applied in recent related LV network modelling work [7][2][8][9][10][11][12].
The constraint limits for the VPP trial are calculated for 25 different prototype scenarios
categorised by day-type and month of the year, as outlined in Table 1. Each day-type scenario
specifies constraints in 5-minute intervals over a 24-hour period for every transformer in SAPN’s
network. The scenarios specify typical constraints for work and non-workdays for each month of
the year, and include an additional scenario for heatwave days (typically characterised by high
temperatures and high air conditioning demand).
Table 1. The 25 scenarios modelled by the constraint engine
Month
Workday
Heatwave
Models are
produced for each
of the 12 months
Each month has both
workday and non-
workday models
A heatwave scenario is also modelled. This is based on a
January non-workday, but could in theory be used for a
heatwave at any time of year
1
.
Raw capacity constraints
For each of the 25 scenarios specified in Table 1, and for each transformer/network node of
interest the constraint engine calculates first a raw constraint estimate using the formula
where:
1
This was a modelling parameter asserted by SAPN.

Analysis of the VPP dynamic network constraint management | 21
• denotes an index that identifies an individual transformer in the set , where
denotes the total number of distribution transformers in question;
•
is the raw constraint limit estimate for the node/transformer in kilowatts, as a
function of time;
• is a discrete time index, for 24-hour profiles
produced in 5-minute intervals;
• is a tuneable confidence margin parameter, , set for example to 0.2 for a
conservative estimate of latent capacity, or to 0.8 for a less conservative estimate;
•
is the estimated maximum reverse power flow limit for voltage exceedance at the
transformer , in kilowatts;
•
is the estimated maximum reverse power flow limit for thermal exceedance at the
transformer , in kilowatts; and
•
is the reverse power flow modelled at a transformer in kilowatts – this is the only
input value that varies in time. This estimated reverse power flow at the transformer is
calculated as the difference between power demand and PV generation based on a set of
representative load and generation profiles calculated for the SAPN network for each of
the characteristic day-types shown in Table 1. These profiles have been developed by SAPN
and are not featured in this report.
The raw constraint limit estimate
at a given transformer is then projected onto the interval
[
5kW,
10kW] to produce a mediated constraint limit
, defined below, which is
distributed through the VPP API to each VPP site connected to transformer . To facilitate the
analysis in this report, the allocation approach [13] adopted is that the capacity limit made
available to the transformer through
is distributed in equal ratio to all the VPP sites
connected to the transformer. In general, the VPP could allocate capacity in different ratios to VPP
sites under the same node.
Two concepts related to
that will be used in subsequent analysis are:
• The average raw capacity constraint per customer connected to transformer ,
Where
is the number of VPP sites connected to the node/transformer , namely, the
total number of sites in the VPP is
. This is shown for nine transformers in
Figure 3.

22 | CSIRO Australia’s National Science Agency
Figure 3 -
plotted for a random sample of nine transformers for a January non-workday with a confidence
margin of 80%.
• The average raw capacity constraint per customer across the entire VPP cohort
This is shown on aggregate across the 584 VPP sites in Figure 4.

Analysis of the VPP dynamic network constraint management | 23
Figure 4 - plotted for all 584 VPP sites for a January non-workday with a confidence margin of 80%.
Mediated capacity constraints
For each transformer , the mediated constraint is calculated using the formula
where
is a saturation function which takes
and restricts it to the interval
[
5 kW,
10 kW]. As a more straightforward stepwise function it can be equivalently
defined as
raised to the static limit 5
dynamic limit capped to 10
Note that the mediated constraint
is indexed per transformer () rather than per
VPP site (
. Also, in the subsequent analysis it is assumed that all VPP sites
connected to a given transformer are allocated an equal share of its capacity.
When it comes to mediated constraints the below analysis will refer to two concepts:
• The average mediated capacity constraint per customer connected to transformer
This is shown for nine transformers in Figure 5.

24 | CSIRO Australia’s National Science Agency
Figure 5 -
plotted for a random sample of nine TFs for a January non-workday with a confidence margin m of
80%.
• The average mediated capacity per customer across the entire VPP cohort
This is shown on aggregate across the 584 VPP sites in Figure 6.

Analysis of the VPP dynamic network constraint management | 25
Figure 6 - plotted for all 584 VPP sites for a January non-workday with a confidence margin of 80%.
Analysis scope and methods
The analyses of DER export capacity limits made available to the VPP (RQ 1) and VPP hosting
capacity (RQ 3) were based on a VPP consisting of 584 sites spread across 425 transformers
according to the connection distribution shown in Table 2. Each VPP site is equipped with a 5-kW
rooftop PV generation system and a Tesla Powerwall energy storage system. Each of these
systems has the capacity to individually export up to 5 kW to the network, adding up to a
maximum DER export capacity of 10 kW per VPP site
2
.
Table 2 – Distribution of VPP sites across transformers considered for analysis.
Number of VPP sites connected
to a common transformer
1
2
3
4
5
6
7
8
Number of occurrences
314
75
29
5
1
0
0
1
The analysis developed to address RQ 1 and RQ 3 consisted of dynamic daily capacity constraint
profiles developed by SAPN for 75,530 transformers in their network – 25 day-type scenarios per
transformer as specified in Table 1. Input data was also provided by SAPN to independently
calculate these profiles using the raw and mediated capacity formulas given in Section 2.2. These
data consisted of transformer voltage and thermal limits, representative reverse power flow, PV
generation, and load profiles modelled for each VPP transformer.
2
Though a Tesla Powerwall 2 has a 10 second peak of 7kW and a 5kW PV system could in theory output 6-7kW for a short time, these scenarios are
not considered in the analysis.
26 | CSIRO Australia’s National Science Agency
The capacity constraint profiles and associated transformer data provided by SAPN was
considered as the source of truth for analysis, which explored the implications of implementing
the proposed dynamic capacity constraint management system based on these profiles. The
analysis did not evaluate the accuracy of the capacity estimates produced by SAPN, nor did it
evaluate the utilisation by the VPP of additional DER export capacity released during the trial.
2.3 Representation of capacity constraints
Figure 7 shows an example estimated constraint profile aggregated over all VPP sites for a non-
workday profile in the month of January; in this case, calculated using a confidence margin
in Equation (1) (the least conservative estimate). There are several metrics which will be
defined in Section 2.4 using Figure 7 as a reference point. As such, the three key features of the
capacity constraint profile in Figure 7 isolated in


28 | CSIRO Australia’s National Science Agency
Table 3 - A visual breakdown of each element of the capacity constraint representation in Figure 7.
Fixed export limits
• These lines are the 5kW and 10kW
export levels per site, for reference.
• The 5kW limit is the minimum exports
SAPN would like to always allow.
• The 10kW limit is the dynamic limit
maximum.
Solar Curve
• An approximate solar curve profile as
defined in Section 2.4 below.
• This varies depending on month of the
year to centre on daylight hours.
• In our calculations this will act as the
real-life capacity limit of the battery +
PV setup.
Mediated Limits
• The average mediated capacity
constraint per customer
as introduced in Section 2.2
above.
• In our calculations this will act as the
theoretical capacity limit of the battery
+ PV setup.
2.4 Capacity metrics
The following metrics will be used throughout the report to quantify the technical implications of
dynamic network constraints in light of the research hypotheses and questions presented in
Section 1.2. Note that metrics introduced below and the analysis that results from them should be
considered as indicative of available capacity and performance as induced by the constraint engine
approximate calculations defined in Section 2.2, based on the prototype modelling developed by
SAPN.

Analysis of the VPP dynamic network constraint management | 29
Approximate solar curve –
An approximate solar curve profile will be used in the calculations of capacity and energy
metrics to be introduced below. The curve , shown in dark blue line in Figure 7 and Table 3
represents a realistic approximation to the effective export capacity of the VPP systems in the
trial, which consist of a battery that can export up to 5 kW and PV panels that could add up to 5
kW, depending on the availability of solar resource. This approximation varies depending on the
time of year and uses sunlight times assuming a PV system based in Adelaide, South Australia.
Since the VPP systems can only reach a 10-kW export level during daylight hours (i.e. when the PV
panels and the battery at a VPP site are both simultaneously exporting at their 5-kW capacity), the
solar curve was introduced to better represent the capacity that can be effectively used by the
VPP. This solar curve is incorporated in the metrics introduced below.
Full detail on how is defined can be found in Error! Reference source not found..
Available Energy –
The available energy is defined as the maximum amount of energy in kilowatt-hours that could
be released in the export capacity band within 5 kW and 10 kW if no constraints were imposed
beyond the availability of solar resource to PV systems. represents the area delimited by the
solar curve and the 5-kW capacity limit, which can be calculated as
where denotes the sampling period in hours underlying the representation of capacity
constraints as a sequence of discrete-time values (
for constraints calculated in 5-minute
intervals). Note that the period of daylight hours
over which is evaluated varies through the
year across the reference day-type scenarios defined in Table 1.
Released Energy –
The released energy is the fraction of the available energy that is released to the VPP
through a mediated dynamic capacity constraint profile. As an aggregate quantity across the
entire VPP, is obtained by restricting to an area delimited by the mediated constraint
curve and the 5-kW limit, namely,
Figure 8 shows an example of as the area highlighted in orange over the constraint profile of
Figure 7.

30 | CSIRO Australia’s National Science Agency
Figure 8 - Released energy shown as the area highlighted in orange on the constraint profile of Figure 7.
It will be useful also to evaluate as an average released energy per customer connected to the
transformer . In this case we will denote it
and calculate it by using the average mediated
capacity constraint per customer
as
Note that, in general,
will be different for different transformers, , where is the
number of transformers considered in the VPP.
Average Available Capacity
The average available capacity is the average capacity in kilowatts allowed by the dynamic
mediated constraint. The average available capacity is calculated in terms of both the total export
capacity made available by the proposed system, and the likely export capacity available when
solar irradiance is considered.
The whole day average available capacity
is calculated by averaging the mediated constraint
, that is
where
is the number of time intervals in the day for which
has been calculated (
for 5-minutely calculated constraints).
The likely average available capacity
due to the limits of solar radiation during daylight hours
is calculated by averaging the boundary (that is, minimum) of the mediated constraint
and
the solar curve
– this can be seen as the green line in Figure 9. That is

Analysis of the VPP dynamic network constraint management | 31
where
is the number of daylight time periods for which the time series
and
have been calculated, which vary through the year according to availability of solar resource,
which was accounted for.
Figure 9 -
and
pointed out explicitly for Figure 7 with the minimum of
and
highlighted in green.
and
can also be calculated as per-transformer metrics
and
for a particular
transformer by substituting
with
in the respective formulae. Since all VPP sites
connected to the same transformer are assumed to be allocated equal capacity,
and
will also be used to characterise available capacity per VPP site.
To give some quantitative grounding to these metrics, the values calculated for the scenario
shown in Figure 9 are provided in Table 4.
Table 4. The key metrics for the scenario shown in Figure 1.
January Non-workday
Confidence 80%
Available Energy
Released Energy
Average Available Capacity
All Day
3
25.7MWh
(43kWh/VPP)
10.1MWh
(39% of AE)
8.4kW
Daylight Hours
6.2kW
3
Recall that the ‘All Day’ estimates are only hypothetical. This considers a scenario where 10kW is exportable for 24 hours and is only affected by
the mediated constraints line . In practice we would not expect this to be possible with the current set up.
4,901kW (8.4kW/VPP site)
3,436kW (5.9kW/VPP site)

32 | CSIRO Australia’s National Science Agency
2.5 Summary of capacity definitions and performance metrics
Table 5 - A summary of the metrics defined throughout Section 2.2 and Section 2.4.
Metric
Notation
Definition
Scope
Raw constraint estimate at
transformer
Eq. (1)
Distribution
transformer kW
Average raw capacity
constraint per customer
connected to transformer
Eq. (2)
VPP site kW
Average raw capacity
constraint per customer
across the VPP
Eq. (3)
VPP site kW
Mediated constraint
estimate at transformer
Eq. (4)
Distribution
transformer kW
Average mediated capacity
constraint per customer
connected to transformer
Eq. (6)
VPP site kW
Average mediated capacity
constraint per customer
across the VPP
Eq. (7)
VPP site kW
Approximate solar curve
See Error! Reference source not found.
VPP site kW
Average available capacity
(whole day and daylight
hours)
VPP site or
distribution
transformer kW
Available energy
VPP site kWh
Released energy
VPP site kWh

Analysis of the VPP dynamic network constraint management | 33
3 Analysis of VPP DER export capacity
RQ 1
To what extent can available DER export capacity be increased compared to the maximum
capacity available under SA Power Networks’ standard connection rules (currently capped
at 5-kW export per customer) using dynamic network constraint management via the
proposed interface between SAPN and the DER aggregator?
3.1 Context
The export of small (≤30kW) DER on the SAPN network is currently restricted through static export
limits per customer. In response to increased solar PV uptake approaching the technical limits of
the network at some locations and times, SAPN lowered this export limit in 2017 from 10 kW to 5
kW per customer per phase.
This reduction in static capacity restricts the export capability of today’s VPPs. The ‘nameplate’
peak power rating of Tesla’s VPP at the end of its second phase of deployment (1,000 customers)
will be 10 MW, as each customer has a 5-kW capacity solar inverter and a 5-kW capacity battery
inverter, which would be able to jointly export up to 10 kW. However, under SAPN’s present
connection rules, the static export limit of 5 kW that applies per household limits the maximum
power output of the VPP to 5 MW.
The dynamic constraint management solution developed through the project is intended to
enable the VPP to operate at up to its full rated capacity of 10 MW. As the VPP scales to its target
size of 50,000 customers, the system has the potential to unlock hundreds of MW of peak export
capacity that would otherwise be unusable, significantly increasing the opportunity for the VPP to
participate in the SA energy system, and hence the value released from the VPP.
This section analyses the export capacity that can be released to the VPP based on the dynamic
capacity estimates modelled by SAPN for 425 transformers connected to the VPP. These capacity
estimates were considered as the source of truth to evaluate the potential to increase DER export
capacity beyond the static limit available under SAPN connection rules. We quantify this
additional export capacity in terms of the metrics introduced in Section 2.4, average available
capacity and released energy . The analysis did not consider utilisation of released capacity,
nor the performance of the capacity estimates provided.
Key points from the analysis below indicate that dynamic network constraint management can
enable increases in daily average DER export capacity from 5 kW to over 8 kW across the year, and
up to 10 kW during winter months. In practice, however, these estimates can be misleading
because much of the enabled capacity typically occurs during non-daylight hours, when the PV
systems cannot generate or export and therefore the VPP’s own capacity is limited to the size of
the battery’s export inverter. A more accurate average of the exploitable capacity is derived by
limiting the analysis to the time of the day when PV generation is active. Using this approach, it is
found that the network can still be increased in average during daylight hours from 5 kW to 6 kW
across the year, and up to over 8 kW during the winter months.

34 | CSIRO Australia’s National Science Agency
The analysis of variability of the dynamic capacity estimates indicates that the maximum increases
in DER export capacity could be achieved across the VPP from May to August, and for 50% of the
network spanned by the VPP from March to August. Less than 20% of the network spanned by the
VPP can be allocated the maximum increases in DER export capacity across the year.
3.2 Seasonal variability of average available capacity
We analyse the DER export capacity released to the VPP through the year using the average
available capacity metric introduced in Section 2.4. This metric represents a daily average
capacity in kilowatts made available to the VPP as an aggregate of the 584 VPP sites considered.
We evaluate in two distinct ways by averaging the available capacity released to the VPP over
the 24 hours of the day, denoted
, and over the period of daylight hours, denoted
. Note
that the available capacity captured by
is a more realistic representation of the additional
capacity over 5 kW that is technically usable by the VPP through simultaneous exports from the
battery and PV systems. Both
and
are shown normalised by the number of VPP sites
and thus range between 5 kW and 10 kW.
Figure 10 shows how
and
vary through the year for the non-workdays, workdays and
heatwave dynamic constraint scenarios specified in Table 1. As seen from these plots, the average
available capacity that can be released to the VPP by dynamic constraints is generally at a
maximum in winter months and at a minimum in Summer months. A large difference can also be
appreciated between the average capacity available over the whole day (
) and that available
only during daylight hours (
), when the network is seen typically more congested.

Analysis of the VPP dynamic network constraint management | 35
Figure 10 – The average available capacity for the aggregate of 584 VPP sites throughout the year, calculated with
confidence margin based on the day-type scenarios defined in Table 1. The heatwave-day scenario is
represented together with non-workdays in January without implication that it could not occur at other times.
It follows from the plots of
and
in Figure 10 that as a result of the proposed dynamic
management of network constraints,
• DER export capacity can be increased in average over the whole day from 5 kW to over
8 kW (a 60% increase in capacity) across the year, and up to 10 kW (a 100% increase in
capacity) during Winter months (workdays);
• DER export capacity can be increased in average during daylight hours from 5 kW to over
6 kW (a 20% increase in capacity) across the year, and up to no less that 8 kW (60%
increase in capacity) during Winter months;
• Average available capacity for additional DER exports during daylight hours is at its lowest
in the year during non-workdays in Spring (October-November), at around 6 kW (20%
increase in capacity);
• Very high temperature days (heatwave days) offer opportunities for increased DER export
capacity to more than 9 kW (80% increase in capacity) in average over the whole day, and
more than 7 kW (40% increase in capacity) in average over daylight hours;
• DER export capacity can generally be increased more during workdays than during non-
workdays – up to 1 kW (20% more) during the months of March and April.
This analysis demonstrates the potential advantages of adopting the proposed dynamic constraint
management interface to increase DER export capacity. Without dynamic locational constraints,
the capacity made available through a static limit is capped at 5kW (or likely lower in the future) at
all times. If SAPN’s constraint engine correctly estimates the parameters of the network, then
even at the times in the year when the network is most congested, an additional 1 kW (20%
36 | CSIRO Australia’s National Science Agency
increase in DER export capacity) per VPP site can be unlocked by a regime of dynamic constraints.
At the times when the network is least congested, an additional 3 kW (60% increase) can be
unlocked during daylight hours, and up to 5 kW (100% increase) as a whole day average.
Note that these estimates consider the VPP as an aggregate of 584 sites, and thus do not indicate
how capacity could be allocated by accounting for diversity across VPP nodes, which is modelled in
the constraint engine calculations. While additional network capacity for DER exports can be
unlocked by dynamic constraint management, in reality this capacity is not homogeneously
distributed and can only be allocated in certain parts of the network. This brings the discussion to
examining how this available capacity is distributed across the network.
3.3 Distribution of available capacity across the VPP
Figure 11 and Figure 12 present boxplots to graphically show how the average available capacities
per VPP site,
and
, are distributed across the 584 VPP sites considered in the analysis.
The height of the rectangular boxes shown for each month of the year represents the distribution
of available capacities for 50% of the sites. The box can collapse to a line in months when the
distribution of capacities is very narrowly concentrated around a single capacity value, as is for
example the case for the months of June and July in both figures.
The horizontal line inside the box represents the median of the distribution, such that 50% of the
data sits above and below this line. For example, in Figure 11 the median line of the distribution of
for non-workdays in December is at 8 kW, which means that in those days half of the VPP
sites can be allocated at least 3 kW additional DER export capacity in average over the day. This
additional capacity, however, is mostly available outside daylight hours, as seen from the
corresponding box for
shown in Figure 12, where the median line sits just above 5 kW.
The lower and upper edges of the box mark the lower and upper quartiles of the data, so that
each section of the box subdivided by the median line represents 25% of the sites. For example,
the lower quartile line in the distribution of
for workdays in April, in Figure 12, sits just
above 6 kW, which means that in those days over 75% of the VPP sites can be allocated more than
6 kW DER export capacity.
The boxes may show lines extending from the lower and upper edges (whiskers) that represent
variability outside the lower and upper quartiles. Any data which is outside 1.5 times the
interquartile range is plotted as a dot and is typically considered an outlier.
The distribution of per-site DER export capacities in Figure 11 and Figure 12 is seen to follow a
seasonal variability through the year similar to that seen in Figure 10 for the VPP as an aggregate,
as could be expected. The boxplots also depict how these capacities vary across the VPP sites.

Analysis of the VPP dynamic network constraint management | 37
Figure 11 – The distribution whole day average available capacity
across the ensemble of VPP sites for both
workdays and non-workdays during daylight hours with an 80% confidence margin
Figure 12 – The distribution likely average available capacity
(additional capacity over the 5 kW limit that can
be allocated during daylight hours) across the ensemble of VPP sites for both workdays and non-workdays during
daylight hours with an 80% confidence margin
These boxplots show that not all VPP sites can be allocated the same levels of DER export capacity
through the year. From May through to August the distributions are tight, which indicates that
almost all sites are likely to be allocated the highest increases in DER export capacity – 100%
increase as an average over the whole day (Figure 11), and 60% increase as an average during
daylight hours (Figure 12). Thus, the colder months of the year present opportunity for the most
substantial increases in DER export capacity across the VPP, excluding outlier sites.
The rest of the year shows larger spreads in available capacity, which can vary from 1 kW to 2 kW
as a whole-day average (Figure 11), excluding an outlier on 5 kW. During daylight hours, there are
comparatively many more sites close to the 5 kW lower limit (Figure 12).

38 | CSIRO Australia’s National Science Agency
These variabilities may be further analysed in four broad seasonal categories according to
similarities in median capacity and spread: Autumn (March & April), Shoulder (May and August),
Winter (June and July) and Summer (September through February), as shown in Figure 13.
Figure 13 – System capacity constraint seasons
Figure 14 and Figure 15 show for these seasonal categories how the spread of average available
capacities across transformers changes when considering average capacities over the whole day as
compared to over daylight hours (the most likely usable by the VPP).
While the peak at the highest available capacity stays around the same height between both
figures (10 kW in Figure 14 and 8.5 kW in Figure 15), it is reduced by around 1.5 kW over daylight
hours. The secondary peaks in available capacity, which are around 7.5 to 8 kW in Figure 14, are
reduced to 5 to 5.5 kW in Figure 15. Hence, not only available capacity during daylight hours is
reduced for transformers with the highest capacity, but is also relatively further reduced for
transformers with the second highest available capacity.
Figure 14 – The density of whole day average available capacity
across the ensemble of VPP sites for both
workdays and non-workdays during daylight hours with an 80% confidence margin

Analysis of the VPP dynamic network constraint management | 39
Figure 15 - The density of likely average available capacity AC_(i,dl) (additional capacity over the 5 kW limit that can
be allocated during daylight hours) across the ensemble of VPP sites for both workdays and non-workdays during
daylight hours with an 80% confidence margin
Figure 16 and Figure 17 present a view on seasonal variability in terms of the percentage of
transformers at each available capacity level. Regardless of whether capacity is computed as an
average over the day, or during daylight hours, it can be seen in these figures that only around
20% of the transformers reach the maximum capacity available across all seasons, with Summer
non-workdays showing the lowest, and Winter workdays showing the highest (around 90% reach
maximum capacity available).
Figure 16 – The percentage distribution of whole day average available capacity
across the ensemble of VPP
transformers for both workdays and non-workdays during daylight hours with an 80% confidence margin
Once again, we see by comparing Figure 16 and Figure 17 that a higher percentage of
transformers shows low available capacity during daylight hours. The plots also show that the
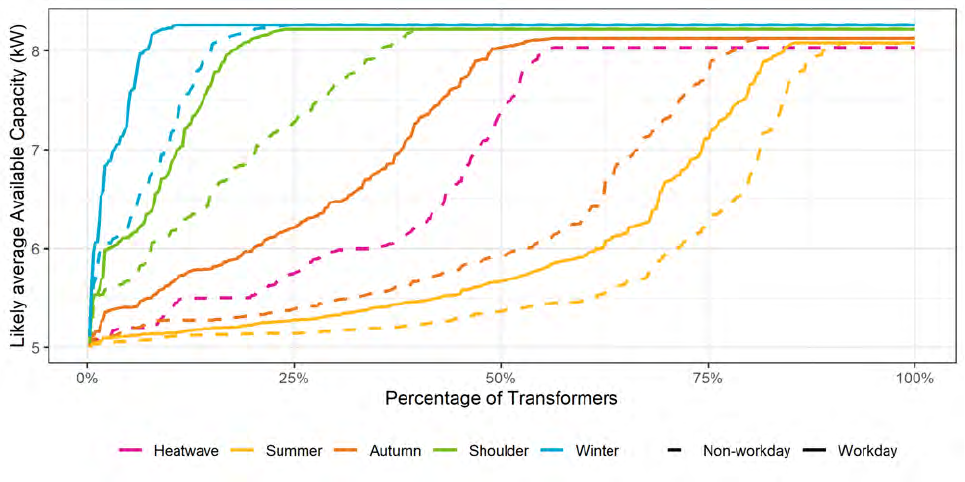
40 | CSIRO Australia’s National Science Agency
capacity available during heatwave days is comparable to that available in the Autumn period
(March-April, see Figure 13).
Figure 17 – The percentage distribution of likely average available capacity
(additional capacity over the 5 kW
limit that can be allocated during daylight hours) across the ensemble of VPP transformers for both workdays and
non-workdays during daylight hours with an 80% confidence margin
In summary, the analysis of variability of available capacity across the VPP indicates that
• Maximum increases in available capacity for DER exports could be enabled by dynamic
constraints across the VPP during the months of May to August: up to a 100% capacity
increase as an average over the whole day (from 5 kW to 10 kW), and a 60% capacity
increase during daylight hours (from 5 kW to 8 kW).
• Less than 20% of the transformers connected to the VPP can be allocated the maximum
increases in capacity enabled by dynamic constraints across the year.
• More than 30% of the transformers connected to the VPP can be allocated at least a 20%
increase in capacity (from 5 kW to 6 kW) in average during daylight hours across the year,
and at least a 70% increase in capacity as an average over the whole day across the year.
• Around 50% of the transformers connected to the VPP can be allocated the maximum
increases in capacity enabled by dynamic constraints for 6 months of the year from March
to August.
• Heatwave days present opportunities to allocate the maximum increases in capacity for
around 55% of the transformers connected to the VPP.
3.4 Released energy
We move the focus of the analysis to examine impacts of increasing DER export capacity as
measured by DER energy exports. We evaluate and analyse the distribution of the released energy
metric across the VPP calculated using the formula defined in Section 2.4. Recall that
quantifies the fraction of available energy that can be exported to the network as capacities
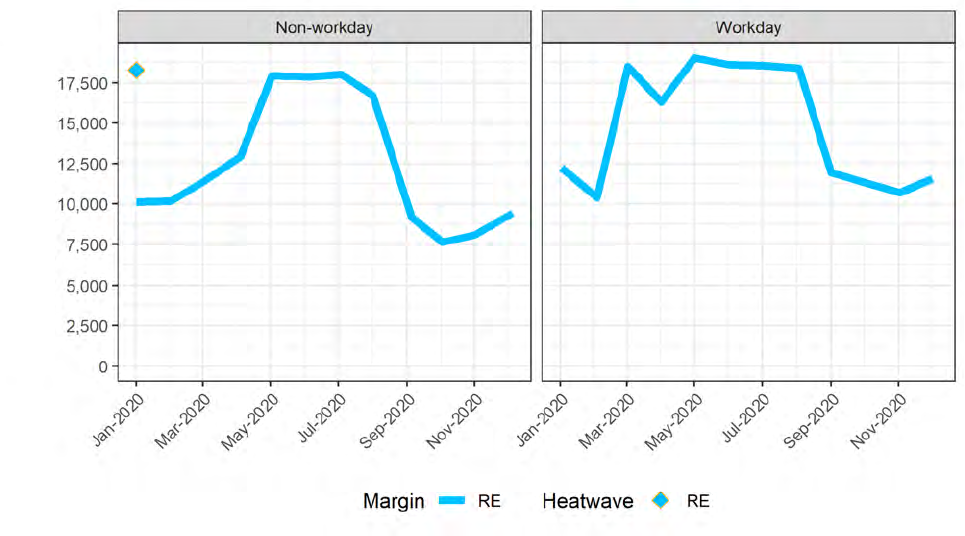
Analysis of the VPP dynamic network constraint management | 41
greater than 5 kW are allocated by the constraint engine. These capacities are delimited by the
mediated constraint limit
and the solar curve , as illustrated in Figure 8.
Figure 18 shows the released energy in kilowatt-hours per day as an aggregate for the VPP across
the year. The annual peak in released energy, between 17.5 MWh and 18.5 MWh per day, occurs
in the months from May to August, despite the fact that solar resource is more limited in those
months of the year. This is a consequence of the additional capacity that can be made available
during these months, as discussed in the preceding analysis of potential DER export capacity in
Section 3.2. The released energy drops by about 10 MWh in the following months to its lowest
values in the year in October and November, following the drop in estimated average available
capacity during daylight hours. Note that the released energy metric only integrates available
capacity above the 5-kW limit as an average during daylight hours only, because it is shaped by the
solar curve, which reduces released energy to zero when PV generation is not active.
Figure 18. The aggregate Released Energy for confidence margin of 80% for all sites under all scenarios
Figure 19 shows how released energy per VPP site is distributed across the VPP. Figure 20 shows
the distribution of released energy across the VPP transformers.
It is interesting to note in Figure 19 that although in the Winter period the released energy
estimates are consistently higher than in the Summer period, the peak in the Winter period is
lower than in the Summer period. This may be attributed to the increased availability of solar
resource in the Summer period. While the network is less constrained in the Winter period, there
is also less opportunity to generate high energy exports from solar, which explains why the
aggregate released energy output of the network as a whole is lower.
Aggregate released energy per day (kWh)
(kWh)

42 | CSIRO Australia’s National Science Agency
Figure 19 – The distribution of Released Energy across the ensemble of VPP sites for both workdays and non-
workdays during daylight hours with an 80% confidence margin
This observation can also be made from Figure 20, which shows the variability of potential
released energy across the ensemble of VPP transformers. It can be seen that in the Winter
workdays, around 90% of transformers could release maximum energy at a level of around
32.5 kWh per transformer, which is lower than the 45 kWh of released energy per transformer
seen in the heatwave scenario. In the heatwave scenario, however, only around 45% of
transformers reach that level of released energy.
We also observe that most of the released energy is typically associated to a minority of the VPP
sites. Observe for example in Figure 20 that released energy levels of around 17 kWh are only
typically available to around 25% of VPP sites during non-workdays. For reference, approximately
17 kWh are the released energy share per VPP site resulting from Figure 18 in January, non-
workdays (10 MWh divided by 584 VPP sites).

Analysis of the VPP dynamic network constraint management | 43
Figure 20 – The percentage distribution of Released Energy across the ensemble of VPP sites for both workdays
and non-workdays during daylight hours with an 80% confidence margin
3.5 Summary of findings
This section analysed potential DER export capacity that can be allocated to the VPP beyond the
capacity allowed by the standard static 5 kW DER export limit. The analysis was based on the
evaluation of daily average available capacity and daylight daily average capacity as estimated by
the SAPN constraint engine for 425 transformers connected to the VPP. A caveat is in order in
regards to the quantification of DER export capacity as a daily average, which can be misleading
for PV export capacity. Indeed, since DER export capacity is typically the lowest during daylight
hours in feeders with high PV penetration, network capacity available for PV exports is more
realistically represented as a daylight average.
The analysis found that the dynamic constraint management approach implemented by the
proposed SAPN API can increase the DER export capacity that can be allocated to the VPP as a
function of the DER location, the type of day (work or non-work) and the month of the year.
The analysis estimates that DER export capacity can be increased as a daily average from 5 kW to
over 8 kW across the year, and up to 10 kW during Winter months. During daylight hours, average
DER export capacity can be increased from 5 kW to 6 kW across the year, and up to over 8 kW
during the Winter months.
Average available capacity achieves maximum values in the Winter months, when dynamic
constraint management can allocate DER export capacity to the level of 10 kW daily, and up to
8 kW during daylight hours.
All of the transformers connected to the VPP have potential for the maximum increases in DER
export capacity during the months from May to August, while half of the transformers can be
allocated the maximum increases in DER export capacity for 6 months of the year from March to
44 | CSIRO Australia’s National Science Agency
August. Less than 20% of the transformers connected to the VPP show potential for the maximum
increases in DER export capacity across the year.
The findings regarding released energy are consistent with those for average available DER export
capacity during daylight hours. Similar seasonal variability is observed, with maximum estimated
levels of released energy as an aggregate for the VPP occurring during the winter months.

Analysis of the VPP dynamic network constraint management | 45
4 Analysis of VPP DER hosting capacity
RQ 3
To what extent can the proposed interface allow distribution networks to host DER at
higher levels of penetration by enabling dynamic, locational export limits compared to
standard static per-customer export limits?
4.1 Context
In networks with a high penetration of DER such as South Australia, the physical limitations of the
distribution network are a potential roadblock to the widespread adoption of VPP technology. This
is relevant in the South Australian context, not solely due to the Tesla VPPs target size of 50,000
customers, but also due to State Government subsidy schemes aiming to encourage the
installation of another 40,000 VPP-ready batteries. These subsidy schemes have already led to the
formation of a VPP ecosystem in South Australia, with new VPPs regularly entering the market.
In the absence of more sophisticated approaches, more widespread aggregation of DER into VPPs
could mean that today’s static per-household export limits may need to reduce further to protect
the integrity of the network. Static per-household export limits likely leave a great deal of available
network capacity un-tapped and prevent VPPs from operating at their full potential.
This research question seeks to demonstrate how, as the South Australian VPP ecosystem grows,
the proposed approach can remove this roadblock to the greatest extent possible while protecting
the safety and security of supply for all customers.
The analysis below shows that DER hosting capacity can be increased significantly by enabling
dynamic, locational export limits. The proposed dynamic constraint management solution can
support flexible management of available network capacity to host a significantly higher volume of
DER than that would be allowed by standard static constraint limits.
The evaluation of available capacity below shows that, compared to standard static per-customer
export limits, dynamic export limits enable the network to host
• 25% more DER if their exports are dynamically managed to operate unconstrained 90% of
the time,
• 55% more DER if their exports are dynamically managed to operate unconstrained 80% of
the time,
• 300% more DER if their exports are dynamically managed to operate unconstrained 50% of
the time.
In other words, the network can host more DER if DER exports are constrained some of the time.
How much more DER can be hosted depends upon how often exports are constrained: more
constraints enable more DER to be hosted.
46 | CSIRO Australia’s National Science Agency
4.2 Availability of DER export capacity
The availability of DER export capacity across SAPN’s network is assessed based on the raw
capacity estimate modelled by SAPN (see Section 2.2), which are again considered as the source of
truth for network capacity. The distribution of network capacity is calculated across an entire year
using the monthly estimated capacity profiles generated by the constraint engine for 75,530
transformers in SAPN’s network.
The analysis in Section 3 already shows that dynamic export limits can enable additional DER
export capacity over that achievable with the standard static export limits of 5 kW. The time-
varying nature of dynamic constraint management captures the variability of network capacity
through the hours of the day, the days of the week, and seasonally. With a view to capture
maximal network utilisation, available capacity is evaluated with a dependency on the level of
network congestion resulting from DER exports if the available capacity were allocated.
Indeed, latent network capacity could be allocated to host a number of DER that could operate
without any curtailment of their allowed export capacity. However, a larger number of DER could
be hosted if these DER were allowed unconstrained exports except at times of network
congestion. In other words, we consider questions such as “What is the capacity available to host
DER to operate unconstrained through the entire year?”, and “What is the capacity available to
host DER to operate unconstrained 90% of the time in the year?”
Consider for example a transformer that is maximally constrained (with minimum share of
network capacity) during a few days of highest congestion Spring. Suppose that during those days
of highest congestion the constraint engine estimates that there is room for an additional 15 kW
of export capacity available for that transformer (indicated by a constraint limit of 15 kW). There is
some flexibility in how this available capacity could be used to host new DER:
• Allow 15 kW of new DER export capacity to be connected to the transformer. If the
constraint capacity estimates are accurate, these new DER can operate unconstrained
100% of the time and dispatch their full 15 kW export capacity at all times across the year.
• Allow more than 15 kW of new DER export capacity to be connected to the transformer. In
this case, the new DER would operate unconstrained at all times their exports are below
15 kW, but would be constrained to 15 kW otherwise.
Thus, export capacity could be overallocated to host more DER in the network under the condition
that the DER capacity can be dynamically constrained at times of high network congestion, as
determined by the constraint engine estimates.
This example shows that it is possible to stretch DER hosting capacity beyond the technical limits
of the network as long as the hosted DER can be dynamically managed and constrained at times of
network congestion. In this sense, dynamic constraint management can support flexibility in
hosting capacity to increase DER numbers and utilisation of common infrastructure.
To illustrate this idea in more concrete terms, we calculated the capacity of DER that could be
hosted without constraints. Namely, operating 100% of the time unconstrained. We also
calculated how much additional DER capacity could be hosted if the DER were to operate
constrained a percentage of the time through the year during periods of high network congestion.

Analysis of the VPP dynamic network constraint management | 47
We considered unconstrained operation for 99%, 90%, 80% and 50% of the time in average
through the year. The results are shown in Figure 21.
The available capacity of each transformer in the network is evaluated using the raw
constraint
defined in Section 2.2. Note that
is absolute raw capacity that can be
allocated to the transformer, rather than additional capacity over the standard static 5-kW
constraint limit, as considered in Section 3. If a transformer’s capacity falls below 0 kW it is
considered caped at 0 kW with no capacity available.
The available capacities calculated for the 75,530 transformers considered are then summed to
produce Figure 21, which provides an estimate of DER hosting capacities that would be available
as a function of the percentage of time across the year that the network would remain
unconstrained once the capacity allowance is utilised.
Figure 21 – The summed available capacity across all 75,530 transformers in SAPN’s network using a 0kW reference
We observe from Figure 21 that the network could host up to 200 MW of additional export
capacity for DER operating 100% of the time unconstrained. In other words, these 200 MW
represent the DER hosting capacity of the network to exhaust the latent capacity at all
transformers to allow unconstrained DER exports. By enabling dynamic, locational export limits to
manage DER exports, the network could alternatively host:
• up to 210 MW of additional export capacity for DER operating unconstrained 99% of the
time on average across the year;
• up to 250 MW of additional export capacity for DER operating unconstrained 90% of the
time on average across the year;
• up to 310 MW of additional export capacity for DER operating unconstrained 80% of the
time on average across the year;
• up to 600 MW of additional export capacity for DER operating unconstrained 50% of the
time on average across the year.
Note that the relationship between DER hosting capacity and the percentage of the time DER can
operate unconstrained is nonlinear. For example, observe that hosting capacity for DER exports
could triple from 200 MW to 600 MW if the hosted DER were to operate unconstrained 50% of the
time rather than 100% of the time.

48 | CSIRO Australia’s National Science Agency
An insight into the current level of congestion of the network may be gained by analysing the
distribution of the available capacity across all transformers. Table 6 shows the percentage of
transformers clustered according to their available capacity to host DER exports operating 100% of
the time unconstrained. In this scenario, 56.1% of the transformers have no capacity available, and
even for those transformers with capacity available, an additional 30.7% of transformers have less
than 1 kW available.
Table 6 – Percentage of transformers with listed available capacity if they are to remain unconstrained for 100% of
the time.
0kW
1kW or less
2kW or less
3kW or less
10kW or less
20kW or less
30kW or less
56.1%
86.8%
90.9%
92.2%
95.4%
97.2%
98.0%
4.3 Summary of findings
The analysis of raw capacity constraints across SAPN’s network reveals that DER hosting capacity
can be increased significantly by enabling dynamic, locational export limits. The evaluation of DER
hosting capacity assumes that DER exports are dynamically managed through the proposed VPP
API or an equivalent interface.
The time-varying nature of network capacity captured by dynamic export limits can be exploited to
further increase hosting capacity and network utilisation by allowing temporary constraints to DER
exports. The evaluation of available capacity shows that, compared to standard static per-
customer export limits, dynamic export limits can enable the network to host
• 25% more DER if their exports are dynamically managed to operate unconstrained 90% of
the time,
• 55% more DER if their exports are dynamically managed to operate unconstrained 80% of
the time,
• 300% more DER if their exports are dynamically managed to operate unconstrained 50% of
the time.
While the DER hosting capacity of the network is a limited resource, the proposed dynamic,
locational constraint management approach provides flexibility for more efficient utilisation and
management of existing infrastructure.

Analysis of the VPP dynamic network constraint management | 49
5 Analysis of VPP costs and benefits
RQ 5
What are the costs of implementing the proposed dynamic network constraint
management assessed against benefits obtained?
RQ 6
What additional economic value can be enabled to DER operators by dynamic network
constraint management, through enabling higher utilisation of existing network capacity?
5.1 Overview
The following sections describe the costs of developing and implementing the proposed dynamic
network constraint management using the actual costs of implementation, the method used to
calculate the wholesale energy market benefits of VPP operation, and the key inputs used in the
model. The analysis provides the estimated benefits to the VPP operator, net present value and
benefit cost ratio.
5.2 Methodology
Costs for the analysis are based on an audited representation letter by SAPN. This cost was
assumed to be upfront in the first year of the trial, without ongoing costs.
Based on the data made available for the analysis, benefits to the VPP DER operator are estimated
in terms of the additional market value of energy able to be dispatched by the VPP under the
proposed dynamic limit scheme above what would have been possible under standard static
export limits. This analysis builds on the approach undertaken by SAPN in the LV Management
Business Case developed as part of its regulatory submission for 2020-25 [14] using as a reference
to understand the overall value of the energy released a study commissioned by SAPN with
Houston Kemp [15].
Additional wholesale electricity market benefits (spot market revenue streams) that accrue to the
VPP provider based on the implementation of dynamic network export limits are estimated for
three cases based on static export limits (representing an upper bound on benefits):
• 2 kW Static network export limits by implementing an API to exchange real-time and
locational data on distribution network constraints between SA Power Networks and the
customers’ DER aggregator (VPP provider).
• 5 kW Static network export limits by implementing an API to exchange real-time and
locational data on distribution network constraints between SA Power Networks and the
customers’ DER aggregator (VPP provider).
• 10 kW Static network export limits by implementing an API to exchange real-time and
locational data on distribution network constraints between SA Power Networks and the
customers’ DER aggregator (VPP provider).
50 | CSIRO Australia’s National Science Agency
The cost-benefit analysis used simulated data in regard to customer load profiles and PV
generation output, assuming 1,000 simulated VPP sites – the targeted deployment in Tesla’s VPP
rollout in SA – with the number of premises remaining constant for the analysis period of 10 years.
The simulated data was generated by a linear optimization model with perfect foresight
developed by Tesla with the objective of maximizing energy arbitrage and contingency profits
earned by a VPP battery energy storage system (BESS), subject to a number of constraints.
5.3 Costs
Based on an audited representation letter by SAPN, the actual costs of implementing the VPP for
Tesla was $460,065. This cost was assumed to be upfront in the first year of the trial. No ongoing
costs were assumed in future years.
5.4 Benefits
Benefits to the VPP DER operator will be estimated in terms of the additional market value of
energy able to be dispatched by the VPP under the dynamic limit scheme above what would have
been possible under static export limits. This analysis will build on the approach undertaken by
SAPN in the LV Management Business Case developed as part of its regulatory submission for
2020-25 [14] using, as a reference to understand the overall value of the energy released, a study
commissioned by SAPN with Houston Kemp [15].
This section will outline the calculation of additional wholesale electricity market benefits (spot
market revenue streams) that accrue to the VPP provider based on the implementation of
dynamic network export limits. The benefits were calculated for three cases:
• 2 kW static network export limits,
• 5 kW static network export limits, and
• 10 kW static network export limits.
With the data available at this stage of the project, all three cases are using static limits to
estimate the upper and lower bounds of potential value.
This cost-benefit analysis used simulated data for both customer load profiles (Section 5.4.2) and
solar PV output (Section 5.4.3).
The proposed methodology assumed 1,000 simulated customer premises, the targeted
deployment in Tesla’s VPP rollout in SA, with the number of premises remaining constant for the
analysis period of 10 years.
5.4.1 Model
Tesla have developed a linear optimisation model with perfect foresight with the objective of
maximizing energy arbitrage and contingency profits earned by a VPP battery energy storage
system (BESS), subject to a number of constraints.
The model has a number of inputs:

Analysis of the VPP dynamic network constraint management | 51
• Half-hourly price trajectories for all markets ($/MWh): Energy, 6sec FCAS Raise & Lower,
60sec FCAS Raise & Lower, 5min FCAS Raise & Lower
o 2019: historical SA price curves for all markets
o 2021: third-party consultant forecasted SA prices in all markets
• Half-hourly load and PV profiles (kW)
• BESS capacity, duration, roundtrip efficiency, and cycle limit
• Site export limit: 0kW, 2kW, 5kW and 10kW
• Site import limit: none
• SAPN fees: Residential Time of Use tariffs from NUoS (Network Use of System) schedule
2020/21
• Feed-in tariff is set to zero
• Annual cycle limit set to 365 cycles/year.
The model optimises VPP charge and dispatch over time, by seeking to maximise profit from
buying and selling into the eight markets. The registered capacity of each BESS (5 kW solar inverter
and 5 kW Powerwall 2) is shown in Table 7. The operation of each BESS in the VPP is modelled
independently (single site not coordinated optimization).
Table 7: Registered capacities as per AEMO’s 0.7 % droop setting for SA VPP
Registered capacity
Load
Generator
Lower
Raise
Lower
Raise
Energy
0.005 MW
0.005 MW
Regulation
0 MW
0 MW
0 MW
0 MW
FCAS 6 s
0.005 MW
0 MW
0 MW
0.005 MW
FCAS 60 s
0.005 MW
0 MW
0 MW
0.005 MW
FCAS 5 min
0.005 MW
0 MW
0 MW
0.005 MW
For the present analysis, the model did not consider export limits for FCAS. Accordingly, the
calculation of benefits focussed on energy market arbitrage revenues only.
5.4.2 Customer load profiles
It remains a challenge to access public load profiles due to privacy considerations. For that reason,
we used a mixture of synthetic load profiles based on those of real customers. To construct
synthetic residential load profiles, we started with around 5,000 New South Wales Ausgrid profiles
from the Smart Grid Smart Cities program and found the 5 most representative profiles and their

52 | CSIRO Australia’s National Science Agency
nine nearest neighbours using clustering analysis. We then synthetically created 45 profiles for the
SAPN distribution network area by first scaling in each time period in proportion to the relative
load profile of SA versus NSW for the sample year, and then scaling so that frequency distribution
of the total annual consumption across the 45 profiles approximated that expected for SAPN. This
process should adjust for differences in timing (daytime hours) and climate but is probably
insufficient to account for all differences in gas versus electricity use, for example, between
different states. The SGSC data set did include people with and without gas and with and without
hot water control but the proportions will not match other states.
Of these 45 load profiles, twenty SAPN residential customer profiles (SP_ResCust in the figures
below) were selected by choosing sites with a total load (excluding controlled load) that were
clustered around the average of all sites (approximately +/- 30% of the mean). Controlled loads
were included in the final load profiles of the selected sites. Profiles for selected Summer day for
three clusters of customers are shown in, respectively, Figure 22, Figure 23 and Figure 24.
4
Figure 22: Summer day load profiles for customers in cluster one: SP_ResCust09, SP_ResCust17, SP_ResCust25,
SP_ResCust27, SP_ResCust43
4
The day profile on the day that the aggregate of all customers demand hit its seasonal peak in summer and winter for each site is shown in
Appendix A.
0
0.2
0.4
0.6
0.8
1
1.2
1.4
1.6
1.8
kW
SP_ResCust09 SP_ResCust17 SP_ResCust25 SP_ResCust27 SP_ResCust43

Analysis of the VPP dynamic network constraint management | 53
Figure 23: Summer day load profiles for customer in cluster two: SP_ResCust06, SP_ResCust19, SP_ResCust24,
SP_ResCust36, SP_ResCust37, SP_ResCust38, SP_ResCust44
Figure 24: Summer day load profiles for customer in cluster three: SP_ResCust02, SP_ResCust05, SP_ResCust11,
SP_ResCust16, SP_ResCust22, SP_ResCust34, SP_ResCust41
It was then assumed that the twenty load profiles were uniformly distributed across the 1,000 VPP
(synthetic) participants.
0
0.5
1
1.5
2
2.5
3
3.5
4
4.5
kW
SP_ResCust06 SP_ResCust19 SP_ResCust24 SP_ResCust36
SP_ResCust37 SP_ResCust38 SP_ResCust44
0
1
2
3
4
5
6
7
8
kW
SP_ResCust02 SP_ResCust05 SP_ResCust11 SP_ResCust16
SP_ResCust22 SP_ResCust34 SP_ResCust41

54 | CSIRO Australia’s National Science Agency
5.4.3 Solar PV output profile
The same solar PV output profile was used in this analysis for each customer. PVWATTS
5
was used
to generate a representative solar profile at the following specification drawn from Adelaide-Kent
Town, Australia:
• 5 kW dc
• 25-degree azimuth
• 15-degree tilt.
The hourly plot of solar PV output over a year (Figure 25) shows increased solar radiation in the
Summer months compared to winter, with monthly statistics shown in Table 8.
Figure 25: Hourly solar PV output, 5kW system, Kent Town, Adelaide
Table 8: Monthly solar radiation and solar PV power production
Month
Solar Radiation
Output
(kWh / m
2
/ day)
(kWh)
January
7.98
912
February
7.12
726
March
6.04
700
April
4.51
520
May
3.29
404
5
https://pvwatts.nrel.gov/pvwatts.php
0
500
1000
1500
2000
2500
3000
3500
4000
4500
5000
1
275
549
823
1097
1371
1645
1919
2193
2467
2741
3015
3289
3563
3837
4111
4385
4659
4933
5207
5481
5755
6029
6303
6577
6851
7125
7399
7673
7947
8221
8495
W
Hours

Analysis of the VPP dynamic network constraint management | 55
June
2.66
322
July
2.9
365
August
3.68
462
September
4.79
575
October
6.05
725
November
7.06
809
December
7.54
870
Annual
5.3
7,390
5.4.4 Estimated benefits
Tesla’s optimisation model was used to estimate the wholesale electricity market benefits (spot
market) that accrue to the VPP provider based on the implementation of dynamic network export
limits. The estimated benefits were simulated for three cases: 2kW, 5kW, 10kW static network
export limits by implementing an API to exchange real-time and locational data on distribution
network constraints between SA Power Networks and the customers’ DER aggregator (VPP
provider).
With the data available from the analysis, the dynamic export limit is approximated by a static
export limit. That is, each customer’s exports are statically limited only by the nominal maximum
(2kW, 5kW or 10kW) irrespective of the state of network congestion at each point in time. Under a
dynamic export limit, customer’s exports may be further limited beyond the nominal threshold to
a lower limit that changes depending on local power flows in order to accommodate network
constraints.
The estimated wholesale energy arbitrage benefits for each of the twenty participants across the
three export limit cases is shown in Figure 26. It shows that the energy arbitrage benefits are
nonlinear, increasing the most when the export limit is 5 kW compared to 2 kW. Average energy
arbitrage benefits per site are $164 in the 2-kW case, $388 in the 5kW case and $423 in the 10-kW
case. Increasing the export limit to 10 kW does result in some additional revenue however it is
constrained by the participants ability to discharge at power significantly more than 5 kW. Exports
at greater than 5 kW are only possible during daylight hours due to 5 kW solar PV and 5 kW
battery system at each site.

56 | CSIRO Australia’s National Science Agency
Figure 26: Annual energy arbitrage benefits by participant and export limit case
5.5 Net present value
The net present value (NPV) calculations are summarised in Table 9 with the detailed calculations
shown in Table 10, Table 11 and Table 12. A real discount rate of 7% p.a. was used to convert
future cash flows to present value terms. As discussed in Section 5.4.1, market prices for two years
(2019 historical year and 2021 simulated year) were used for the optimisation model. The NPV
calculations used an average of these two years.
Table 9: Net present value (NPV) summary
2 kW limit
5 kW limit
10 kW limit
Costs (to 2030, $million)
0.46
0.46
0.46
Benefits (to 2030, $million)
1.23
2.92
3.18
NPV (to 2030, $million)
0.77
2.46
2.72
Increasing static export limit from 2kW to 5kW has the potential to create up to $1.7 million
additional value to the 1000 participants in the VPP. Increasing the static export limit from 2kW to
10kW has the potential to create up to $1.95 million additional value to the 1000 participants in
the VPP.
0
100
200
300
400
500
600
Site
1
Site
2
Site
3
Site
4
Site
5
Site
6
Site
7
Site
8
Site
9
Site
10
Site
11
Site
12
Site
13
Site
14
Site
15
Site
16
Site
17
Site
18
Site
19
Site
20
$
2kW 5kW 10kW

Analysis of the VPP dynamic network constraint management | 57
Table 10: Net present value calculations, 2kW export limit case
2020/21
2021/22
2022/23
2023/24
2024/25
2025/26
2026/27
2027/28
2028/29
2029/30
Total
($2020)
million
0.5
0.0
0.0
0.0
0.0
0.0
0.0
0.0
0.0
0.0
Total (discounted)
million
0.5
0.0
0.0
0.0
0.0
0.0
0.0
0.0
0.0
0.0
Benefits
no of VPP participants
numbers
1000
1000
1000
1000
1000
1000
1000
1000
1000
1000
Energy arbitrage
avg net benefit (2kW)
Tesla model
historical (2019)
million
0.2
0.2
0.2
0.2
0.2
0.2
0.2
0.2
0.2
0.2
avg net benefit (2kW)
Tesla model
projected (2021)
million
0.1
0.1
0.1
0.1
0.1
0.1
0.1
0.1
0.1
0.1
Total (discounted)
historical (2019)
million
0.2
0.2
0.2
0.2
0.2
0.2
0.1
0.1
0.1
0.1
Total (discounted)
projected (2021)
million
0.1
0.1
0.1
0.1
0.1
0.1
0.1
0.1
0.1
0.1
Total (discounted)
average
million
0.2
0.2
0.1
0.1
0.1
0.1
0.1
0.1
0.1
0.1
Costs (to 2030)
average
million
0.5
Benefits (to 2030)
average
million
1.2
NPV (to 2030)
average
million
0.8

58 | CSIRO Australia’s National Science Agency
Table 11: Net present value calculations, 5kW export limit case
2020/21
2021/22
2022/23
2023/24
2024/25
2025/26
2026/27
2027/28
2028/29
2029/30
Total
($2020)
million
0.5
0.0
0.0
0.0
0.0
0.0
0.0
0.0
0.0
0.0
Total (discounted)
million
0.5
0.0
0.0
0.0
0.0
0.0
0.0
0.0
0.0
0.0
Benefits
no of VPP participants
numbers
1000
1000
1000
1000
1000
1000
1000
1000
1000
1000
Energy arbitrage
avg net benefit (5kW)
Tesla model
historical (2019)
million
0.4
0.4
0.4
0.4
0.4
0.4
0.4
0.4
0.4
0.4
avg net benefit (5kW)
Tesla model
projected (2021)
million
0.4
0.4
0.4
0.4
0.4
0.4
0.4
0.4
0.4
0.4
Total (discounted)
historical (2019)
million
0.4
0.4
0.4
0.3
0.3
0.3
0.3
0.3
0.2
0.2
Total (discounted)
projected (2021)
million
0.4
0.3
0.3
0.3
0.3
0.3
0.2
0.2
0.2
0.2
Total (discounted)
average
million
0.4
0.4
0.3
0.3
0.3
0.3
0.3
0.2
0.2
0.2
Costs (to 2030)
average
million
0.5
Benefits (to 2030)
average
million
2.9
NPV (to 2030)
average
million
2.5

Analysis of the VPP dynamic network constraint management | 59
Table 12: Net present value calculations, 10kW export limit case
2020/21
2021/22
2022/23
2023/24
2024/25
2025/26
2026/27
2027/28
2028/29
2029/30
Total
($2020)
million
0.5
0.0
0.0
0.0
0.0
0.0
0.0
0.0
0.0
0.0
Total (discounted)
million
0.5
0.0
0.0
0.0
0.0
0.0
0.0
0.0
0.0
0.0
Benefits
no of VPP participants
numbers
1000
1000
1000
1000
1000
1000
1000
1000
1000
1000
Energy arbitrage
avg net benefit (10kW)
Tesla model
historical (2019)
million
0.5
0.5
0.5
0.5
0.5
0.5
0.5
0.5
0.5
0.5
avg net benefit (10kW)
Tesla model
projected (2021)
million
0.4
0.4
0.4
0.4
0.4
0.4
0.4
0.4
0.4
0.4
Total (discounted)
historical (2019)
million
0.5
0.4
0.4
0.4
0.3
0.3
0.3
0.3
0.3
0.2
Total (discounted)
projected (2021)
million
0.4
0.4
0.3
0.3
0.3
0.3
0.3
0.2
0.2
0.2
Total (discounted)
average
million
0.4
0.4
0.4
0.3
0.3
0.3
0.3
0.3
0.2
0.2
Costs (to 2030)
average
million
0.5
Benefits (to 2030)
average
million
3.2
NPV (to 2030)
average
million
2.7
60 | CSIRO Australia’s National Science Agency
5.7 Summary of findings
The aim of this analysis was to calculate a preliminary cost-benefit analysis for the following two
research questions:
RQ 5. What are the costs of implementing the proposed dynamic network constraint
management assessed against benefits obtained?
RQ 6. What additional economic value can be enabled to DER operators by dynamic network
constraint management, through enabling higher utilisation of existing network capacity?
This cost-benefit analysis used simulated data in regard to customer load profiles and solar PV
output for 1,000 simulated customer premises, the targeted deployment in Tesla’s VPP rollout in
SA with the number of premises remaining constant for the analysis period of 10 years.
The estimated benefits were simulated for three cases:
• 2 kW static network export limits,
• 5 kW static network export limits, and
• 10 kW static network export limits.
All three cases use static limits to estimate the upper and lower bounds of potential value due to
model limitations. Future analysis should consider the value of dynamic limits between these
static limits varying through time.
The analysis found that the estimated wholesale energy arbitrage benefits for each of the twenty
participants across the three cases are nonlinear with export limit, increasing the most when the
export limit is 5kW compared to 2kW. Average energy arbitrage benefits per site equalled $164 in
the 2kW case, $388 in the 5kW case and $423 in the 10kW case. It should be noted that the
matching between system size and export limits would have considerable impact to benefits.
Most benefit would be obtained from export limits that are commensurate with battery output
power.
Increasing the static export limit from 2kW to 5kW has the potential to create up to $1.7 million
additional value to the 1000 participants in the VPP. Increasing the static export limit from 2 kW to
10 kW has the potential to create up to $1.95 million additional value to the 1000 participants in
the VPP.
Follow-up work should include dynamic export limits (rather than static limits assumed here)
based on observations collected from the trial and the inclusion of FCAS revenues in benefit
calculations. An estimate of ongoing costs of VPP implementation also need to be estimated.

Analysis of the VPP dynamic network constraint management | 61
6 Conclusions and opportunities for further work
6.1 Conclusions
This report investigated the potential increases in DER export capacity, increases in network DER
hosting capacity, and the release of economic value enabled by dynamic, locational export limits
communicated via the SAPN API solution implemented in the project.
The analysis reported focused on the following research questions:
RQ 1
To what extent can available DER export capacity be increased compared to the maximum
capacity available under SA Power Networks’ standard connection rules (currently capped
at 5-kW export per customer) using dynamic network constraint management via the
proposed interface between SAPN and the DER aggregator?
RQ 3
To what extent can the proposed interface allow distribution networks to host DER at
higher levels of penetration by enabling dynamic, locational export limits compared to
standard static per-customer export limits?
RQ 5
What are the costs of implementing the proposed dynamic network constraint
management assessed against benefits obtained?
RQ 6
What additional economic value can be enabled to DER operators by dynamic network
constraint management, through enabling higher utilisation of existing network capacity?
RQ 1 was investigated by analysing dynamic capacity estimates modelled by SAPN for 425
transformers connected to the VPP. The analysis found that the dynamic constraint management
approach implemented through the proposed SAPN API can significantly increase the DER export
capacity that can be allocated to the VPP as compared to the maximum capacity available under
SAPN standard connection rules.
RQ 3 was investigated by analysing dynamic capacity estimates modelled by SAPN for 75,530
transformers in their network. The analysis shows that DER hosting capacity can be increased
significantly by enabling dynamic, locational export limits. The proposed dynamic constraint
management solution can support flexible management of available network capacity to host a
significantly higher volume of DER than that would be allowed by standard static constraint limits,
at the expense of constrained DER exports. The network can host more DER if DER exports can be
dynamically constrained some of the time. Much more DER can be hosted if DER exports can be
constrained more often.
RQ 5 and RQ 6 were investigated by conducting a preliminary economic analysis of the benefits of
the approach using simulated customer load profiles for three static limit cases, 2 kW, 5 kW and
10 kW. These static cases provided upper and lower bounds of potential value in the

62 | CSIRO Australia’s National Science Agency
implementation of an API to exchange real-time and locational data on distribution network
constraints between SAPN and the VPP provider.
While further analysis of trial data will be conducted at the end of the field trial to expand on RQ 5
and RQ 6 and address the remaining research questions in [1], the findings of analysis reported at
this stage strongly support the main underlying hypotheses of the project.
H 1
Existing limits on the level of network exports from customers’ renewable energy
systems on the SA distribution network can be increased by as much as two-fold by
implementing an API to exchange real-time and locational data on distribution network
constraints between SA Power Networks and the customers’ DER aggregator (VPP
provider).
H 2
Operating a VPP at higher levels of export power than would otherwise be allowed
under normal static per-site export limits increases the opportunity for the VPP to
provide market and system-wide benefits.
The proposed approach of using dynamic capacity limits to manage hosting capacity appears as a
necessary development in efficiently operating a LV network with high penetration of DER for
increased network utilisation, and the release of value underpinning emerging markets for energy
storage and VPPs.
6.2 Some reflections on further work
This trial is an innovative approach to better managing a network to enable greater adoption and
use of VPPs; indeed, it won ENA’s 2020 innovation award. As ARENA, the ESB, and other
stakeholders increasingly contemplate dynamic operating envelopes as the emerging answer to
allow DER to continue playing an increasingly central role in the electricity grid, this report points
to the need for additional research and analysis in several areas. In general, these opportunities
for additional research can be summarised as technical due diligence and improvement,
stakeholder consensus, and economic analysis.
On technical due diligence, the analysis reported for RQ 1 and RQ 3 was based on estimated
dynamic capacity constraint profiles generated by SAPN constraint engine. At this stage, these
profiles provide an average daily capacity curve per month of the year, and there has been little to
no analysis conducted to demonstrate the accuracy or reasonableness of the constraint engine.
Indeed, there is limited data to even verify the constraint engine, so a data collection exercise is
recommended in addition to additional analysis. As more attention points to dynamic operating
envelopes as the approach to managing low-voltage networks, more technical due diligence,
research, and development is required to demonstrate that the model used to generate such
envelopes or constraints are accurate and reasonable.
While SAPN’s approach to calculating constraints is likely reasonable given the data available to
them, these estimates could be significantly improved by incorporating real-time weather data
and real-time voltage and load data to produce daily forecasts of network capacity.
6
The primary
6
The constraint modelling has been refined by SAPN since the data was first shared to conduct the analysis reported here.
Analysis of the VPP dynamic network constraint management | 63
aim of the present project was to demonstrate the capability, rather than achieving the most
accurate hosting capacity engine.
A combination of data-driven and physics-based state estimation techniques could be considered
for sections of the network where more connectivity information, smart meter data, and
monitored data become available. Commonly agreed upon best practice for data collection, data
sharing, and constraint development can ensure that the use of dynamic operating envelopes and
similar techniques appropriately reflect the actual conditions of the network. Further work
expanding on the SAPN API could also focus on how to communicate and allocate capacity to
multiple VPP providers and non-VPP DER, identifying and managing locational variability of
network capacity.
Regarding stakeholder consensus, there is yet no Australian standard or industry-agreed upon
approach for calculating hosting capacity, but much foundational work has been done by EPRI
[16], [17], and there is ongoing work led by DEIP [13], [18]. Having one would create a number of
benefits, including consistency for VPP developers and clear guidance about how DNSPs should
communicate these limits to their customers. Indeed, developers like Tesla – along with state
governments and hundreds of thousands of households in Australia – are investing significantly
into solar and storage solutions to reduce electricity bills and carbon emissions. The present report
and many others highlight that to enable these customer energy resources to provide the value
these stakeholders anticipate, the network must be planned and operated differently. Consensus
on how precisely that different management might take place – and on how to communicate
network limits to customers, DER aggregators and others – would provide transparency and lower
the overall cost of DER integration.
Another opportunity for consensus exists regarding the definition of average available capacity.
This report highlighted the ability to describe this capacity on either a 24-hour or daylight-focused
basis. Our analysis indicates that, so long as solar energy is a major source of export, the daylight-
based metric is significantly more representative of the exploitable capacity, and should therefore
be the preferred way of communicating average impacts of dynamic hosting capacity limits. A
commonly agreed upon approach for communicating this information would be valuable.
Finally, there is significant room for follow-up work on economic analysis. Our analysis focused on
the increased value to the VPP of implementing hosting capacity analysis. This analysis is wholly
distinct from an economic analysis of the benefit of implementing dynamic constraint limits across
SAPN’s service area. Indeed, one insight from our analysis is that a large benefit of the
introduction of dynamic operating envelopes is that it enables optimised utilisation of hosting
capacity across the network, locationally and in time, enabling additional customers to connect
solar to the network. Future economic analysis could analyse this benefit in addition to that
released to the existing Tesla VPPs.
Furthermore, a more detailed cost-benefit analysis should include dynamic export limits (rather
than static limits assumed in the present report) based on observations collected from the trial
and the inclusion of FCAS revenues in benefit calculations (a recent report from AEMO [4] provides
some insights on VPP revenue from contingency FCAS markets in current VPP demonstrations,
including the present trial). More work is required to determine an accurate cost for developing
and operating a constraints engine. The default cost assumption used in this report -- $460,000 –
is uncertain at best. As discussed above, consensus on the best data and modelling techniques for
64 | CSIRO Australia’s National Science Agency
adequately determining dynamic capacity limits need to be identified and then the cost of
collecting, cleaning, and analysing that data and then communicating it to VPPs (or other DER) can
be accurately determined.

Analysis of the VPP dynamic network constraint management | 65
A.1 The Solar Curve
The solar curve for this work has been approximated by a -
(hyperbolic sine and
inverse-hyperbolic sine) function using the dSHASHo function from R’s gamlss.dist library [19].
This is essentially a four-parameter function which produces a modified normal distribution. In this
case it has been used to modify the kurtosis of the normal distribution to produce a distribution
with wider shoulders – similar to that of a solar curve.
The base for the solar curve has therefore been generated as:
where
is a vector of date times between the sunrise and sunset times for a given day at a
resolution of 1s,
is the mean of those date times in Unix time,
is the standard deviation of
those date times in Unix time, and has been chosen as as this was a good approximation for
the kurtosis of a solar curve.
The curve
was then converted to between the range of 0kW and 5kW to produce the
normalised and scaled
. Finally, this was multiplied by and capped at 5kW, to extend the
maximum solar period in the middle of the day. This means that was then finally derived as:
The curve
can be seen in Figure 27. The sunrise and sunset times have also been included in
this plot for reference, represented in light blue (sunrise) and orange (sunset) vertical dashed
lines, which are based off the Sun’s position for Adelaide’s longitude and latitude and account for
the progressive daily variation through the year. These lines identify the period of daylight hours
and provide an indication as to whether the 10-kW limits that may be allowed by the constraint
engine are likely to be realisable by simultaneous export of battery and solar generation output.
As such the solar curve
is centred on these times.

66 | CSIRO Australia’s National Science Agency
Figure 27 - The solar curve defined based on Sunrise and Sunset times for a January non-workday.


68 | CSIRO Australia’s National Science Agency
Figure 29 – Site load profiles, peak winter day

Analysis of the VPP dynamic network constraint management | 69
A.3 Shortened forms
Abbreviation
Meaning
AEMC
Australian Energy Market Commission
AEMO
Australian Energy Market Operator
API
Application Programming Interface
ARENA
Australian Renewable Energy Agency
BAU
Business as usual
BESS
Battery Energy Storage System
CSIRO
Commonwealth Scientific and Industrial Research Organisation
DEIP
ARENA’s Distributed Energy Integration Program
DER
Distributed energy resources
DNSP
Distribution network service provider
EPRI
Electric Power Research Institute
FCAS
Frequency Control Ancillary Services
ISP
Integrated System Plan
kW
Kilowatt
LV
Low Voltage
MW
Megawatt
NUoS
Network Use of System
PV
Photovoltaic
SA
South Australia
SAPN
SA Power Networks
VPP
Virtual Power Plant
70 | CSIRO Australia’s National Science Agency
A.4 Research hypotheses and questions
The project aims to test the following main underlying research hypotheses:
H 1.
Existing limits on the level of network exports from customers’ renewable energy
systems on the SA distribution network can be increased by as much as two-fold by
implementing an API to exchange real-time and locational data on distribution network
constraints between SA Power Networks and the customers’ DER aggregator (VPP
provider).
H 2.
Operating a VPP at higher levels of export power than would otherwise be allowed under
normal fixed per-site export limits increases the opportunity for the VPP to provide
market and system-wide benefits.
These hypotheses will be tested by analysing data collected during the life of the project to answer
the following research questions:
Managing hosting capacity
RQ 1. To what extent can available DER export capacity be increased compared to the maximum
capacity available under SA Power Networks’ standard connection rules (currently capped
at 5kW export per customer) using dynamic network constraint management via the
proposed interface between SAPN and the DER aggregator?
RQ 2. To what extent can the proposed interface support maintaining DER operation within the
technical envelope of the distribution network during times when network is highly utilised
(peak solar PV periods), or during unplanned capacity constraints (e.g. network faults or
system-wide contingencies)?
RQ 3. To what extent can the proposed interface allow distribution networks to host DER at
higher levels of penetration by enabling dynamic, locational export limits compared to
standard fixed per-customer export limits?
Visibility
RQ 4. To what extent can the proposed interface securely increase the visibility and management
of DER to network service providers?
Economics
RQ 5. What are the costs of implementing the proposed dynamic network constraint
management assessed against benefits obtained?
RQ 6. What additional economic value can be enabled to DER operators by dynamic network
constraint management, through enabling higher utilisation of existing network capacity?
Analysis of the VPP dynamic network constraint management | 71
Customer impacts
RQ 7. To what extent might the proposed dynamic hosting capacity regime impact on customers
and their take-up of demand management and third-party DER control?
RQ 8. What are the customer impacts, if any, of the dynamic network capacity management
approach?
72 | CSIRO Australia’s National Science Agency
Analysis of the VPP dynamic network constraint management | 73
References
[1] J. H. Braslavsky, L. J. Reedman, J. Brown, and B. Williams, ‘Research plan – Advanced VPP grid
integration’, CSIRO, Newcastle, Australia, Oct. 2019.
[2] T. Crownshaw, A. Miller, S. Lemon, S. McNab, and R. Strahan, ‘Determination of Distributed
Generation Hosting Capacity in Low-voltage Networks and Industry Applications’, presented
at the Proceedings of the EEA Conference & Exhibition 2016, 2016, pp. 1–13 [Online].
Available: https://ir.canterbury.ac.nz/bitstream/handle/10092/15237/UC-GG-16-C-TC-
01_EEA_DG Hosting Capacity_final.pdf?sequence=2&isAllowed=y
[3] Australian Standards Limited / New Zealand Standards, ‘AS/NZS 4777 Part 2: Inverter
requirements’, in Grid connection of energy systems via inverters, 2nd ed., SAI Global Limited,
Ed. 2015.
[4] AEMO, ‘AEMO Virtual Power Plant Demonstrations’, Knowledge Sharing 3, Feb. 2021
[Online]. Available: https://arena.gov.au/projects/aemo-virtual-power-plant-
demonstrations/
[5] ‘Preliminary Report – Detailed Technical Description of VPP API implementation for the
ARENA Advancing Renewables Program’, South Australia Power Networks, Sep. 2020.
[6] A. Gonçalves Givisiez, K. Petrou, and L. F. Ochoa, ‘A Review on TSO-DSO Coordination Models
and Solution Techniques’, in Proceedings of the 21st Power Systems Computation Conference,
Porto, Portugal, 2020, pp. 1–8.
[7] O. Krause, ‘Solar enablement initiative final report’, The University of Queensland, 2019
[Online]. Available: https://arena.gov.au/assets/2018/02/uq-solar-enablement-initiative-
final-report.pdf
[8] Western Power Distribution, ‘Low Voltage Network Templates - Summary Report’, Western
Power Distribution, 2014 [Online]. Available:
https://www.westernpower.co.uk/projects/network-templates
[9] R. Li, C. Gu, F. Li, G. Shaddick, and M. Dale, ‘Development of Low Voltage Network Templates
- Part II: Peak Load Estimation by Clusterwise Regression’. 2015.
[10] A. Aithal, ‘LV Management Strategy Annexe 1: DER Hosting Capacity Assessment. Supporting
document 5.22.1 for SA Power Networks regulatory proposal for the period 2020 to 2025.’,
2018.
[11] P. Morris, E. Meskhi, and M. Sprawson, ‘LV Management Strategy’, EA Technology Limited,
Supporting document 5.21, Dec. 2018 [Online]. Available:
https://www.aer.gov.au/system/files/Attachment 5 Part 8 - Future Network_1.zip
[12] R. Li, C. Gu, F. Li, G. Shaddick, and M. Dale, ‘Development of Low Voltage Network Templates
- Part I: Substation Clustering and Classification’. 2015.
[13] L. Blackhall, ‘On the calculation and use of dynamic operating envelopes’, 2020.
[14] SA Power Networks, ‘LV Management Business Case. Supporting Document 5.18 for SA
Power Networks regulatory proposal for the period 2020 to 2025’, 2019.
[15] Houston Kemp, ‘Estimating avoided dispatch costs and the profile of VPP operation – a
methodology report. Supporting document 5.20 for SA Power Networks regulatory proposal
for the period 2020 to 2025’, 2019.
[16] M. Rylander and L. Rogers, ‘The hosting capacity process’, Electric Power Research Institute,
3002019750, Oct. 2020 [Online]. Available:
https://www.epri.com/research/products/000000003002019750
74 | CSIRO Australia’s National Science Agency
[17] M. Rylander, J. Smith, and L. Rogers, ‘Impact Factors, Methods, and Considerations for
Calculating and Applying Hosting Capacity’, Electric Power Research Institute, 3002011009,
Jan. 2018 [Online]. Available:
https://www.epri.com/research/products/000000003002011009
[18] ARENA, ‘Dynamic Operating Envelopes Workstream’. Australian Renewable Energy Agency,
12-Mar-2021 [Online]. Available: https://arena.gov.au/knowledge-innovation/distributed-
energy-integration-program/dynamic-operating-envelopes-workstream/. [Accessed: 12-Mar-
2021]
[19] D. M. Stasinopoulos and R. A. Rigby, ‘Generalized additive models for location scale and
shape (GAMLSS) in R’, J. Stat. Softw., vol. 23, no. 7, pp. 1–46, 2007, doi:
10.18637/jss.v023.i07.

76 | CSIRO Australia’s National Science Agency
As Australia’s national science agency and
innovation catalyst, CSIRO is solving the
greatest challenges through innovative
science and technology.
CSIRO. Unlocking a better future for everyone.
Contact us
1300 363 400
+61 3 9545 2176
www.csiro.au
For further information
Energy
Julio H. Braslavsky
t +61 2 4960 6071
e Julio.braslav[email protected]
w www.csiro.au/GEES
