
Mitchell Barnes and Wendy Edelberg
ECONOMIC ANALYSIS | SEPTEMBER 2022
Tracking the Robust Recovery in the
Business Sector Since 2020

THE HAMILTON PROJECT MISSION STATEMENT
The Hamilton Project seeks to advance America’s promise
of opportunity, prosperity, and growth.
We believe that today’s increasingly competitive global economy
demands public policy ideas commensurate with the challenges
of the 21st Century. The Project’s economic strategy reects a
judgment that long-term prosperity is best achieved by fostering
economic growth and broad participation in that growth, by
enhancing individual economic security, and by embracing a role
for effective government in making needed public investments.
Our strategy calls for combining public investment, a secure social
safety net, and scal discipline. In that framework, the Project puts
forward innovative proposals from leading economic thinkers—
based on credible evidence and experience, not ideology or
doctrine—to introduce new and effective policy options into the
national debate.
The Project is named after Alexander Hamilton, the nation’s
rst Treasury Secretary, who laid the foundation for the modern
American economy. Hamilton stood for sound scal policy, believed
that broad-based opportunity for advancement would drive
American economic growth, and recognized that “prudent aids
and encouragements on the part of government” are necessary
to enhance and guide market forces. The guiding principles of the
Project remain consistent with these views.
ACKNOWLEDGMENTS
The authors are grateful to John Haltiwanger and Martin Baily
for their insightful feedback on earlier drafts of this paper. This
document would not have been possible without the help and
encouragement of Natalie Tomeh, Moriah Macklin, Marie Wilken,
and Lauren Bauer. Lastly, the authors would like to thank Jeanine
Rees for all of her work with the graphic design and layout of this
document.

September 2022
Tracking the Robust Recovery in the
Business Sector Since 2020
Mitchell Barnes and Wendy Edelberg
The Hamilton Project

Tracking the Robust Recovery in the Business Sector Since 2020 1
Introduction
e onset of the COVID-19 pandemic posed an unprec-
edented threat to the survival of America’s small businesses.
As public health orders at the end of April 2020 restricted
regular activity, more than 40 percent of small businesses
reported temporarily closing a location in the previous
week, with more than 70percent of businesses in the most-
aected service-sector industries reporting closures.
1
Many
feared that, if the pandemic prevented those businesses from
reopening, widespread small business failures could be con-
sequential to the economy and ultimately hamper the recov-
ery much as they did following the Great Recession.
Instead, the business sector appears to have weathered
the COVID pandemic and found a renewed gear of dyna-
mism in the process. According to newly released Business
Employment Dynamics (BED) data from the Bureau of La-
bor Statistics (BLS), nearly 450,000 more business establish-
ments were open for operation at the end of 2021 than at the
end of 2019—double the number of businesses created on
net from the end of 2017 through 2019. is result reects
positive signs in both business survival and new creation.
Although business closings spiked in the rst half of 2020,
data show that most of those closings were only temporary
and that many businesses had reopened within four quar-
ters. Meanwhile, the surge in new business applications that
began in mid-2020 appears to have translated into a near-
record level of new business creation. From the third quarter
of 2020 through the end of 2021, there were nearly 2million
new establishment births, which is more than 20 percent
above the pace of 2018–19.
is entrepreneurship in the face of the COVID pan-
demic also appears to be an international trend. e Econ-
omist found that, in the fourth quarter of 2021, enterprise
entries across Organisation for Economic Co-operation
and Development (OECD) countries were 15percent higher
than they had been before the pandemic (“All Over the Rich
World” 2022). Overall, the authors estimate that an extra
1million rms have been created since the rst lockdowns
compared to prior trend.
Patterns across US industries reveal evidence of econom-
ic restructuring induced by the pandemic period. Many of
the same industries in which existing businesses experienced
severe declines in revenue and elevated establishment exits
in 2020, including restaurants and other, generally personal
services such as hair salons, have also seen some of the larg-
est surges in new business creation (Bungton et al. 2021;
Crane et al. 2022). Other new business activity, including on-
line retail and data services, reect new opportunities in the
transition to a more remote environment (Haltiwanger 2022).
While questions remain around the contribution of these new
dynamics to job creation and productivity, the persistence of
these shis and the continued resilience of small businesses
will play key roles in determining the path of the recovery
moving forward.
1. Data from rst survey period of Census Bureau’s Small Business Pulse Survey,
collected between April 26–May 2, 2020.
Outcomes of Initial Business
Closings
Public health orders issued in March and April of 2020 im-
mediately pushed many businesses to shut down operations
as policymakers pursued a strategy to freeze the economy
in place until the pandemic subsided. A key data challenge
in real time was determining whether a closing had resulted
in a subsequent reopening or in a permanent establishment
death.
2
With the hindsight of new BED data, we can now see
that the 735,000 closings in the second quarter of 2020 did
in fact lead to a quarterly record of nearly 330,000 establish-
ment exits. As shown by the solid purple lines in Figure 1,
deaths of service-sector establishments (panel A) reached
an unprecedented peak of 290,000 in the second quarter of
2020, while deaths among goods businesses (panel B) spiked
to a high not seen since 2010.
However, despite establishment deaths exceeding pre-
pandemic trend by roughly 90,000 in the second quarter, BED
data suggest that the abrupt nature of the COVID lockdowns
and the reopening of the economy allowed a surprising num-
ber of closed establishments to reopen. e dotted purple
lines in the two panels of Figure 1, labeled “Temporary Shut-
downs,” show the number of closed establishments in each
quarter that were later determined to have reopened within
four quarters. In normal periods, temporary shutdowns re-
ect both seasonal businesses and short-term distress. Dur-
ing the second quarter of 2020, however, the number of busi-
nesses shutting down spiked to nearly double the quarterly
peak reached during the Great Recession. Relative to pre-pan-
demic trend, these temporary shutdowns jumped by almost
220,000 establishments. In other words, of the total 305,000
businesses that closed in the second quarter of 2020 above
trend levels, more than 70percent were able to reopen. at
rate was slightly higher among goods-producing businesses
and slightly lower among service-sector businesses. Moreover,
many establishments appear to have been able to reopen im-
mediately: the third quarter saw a surge in reopenings that
was just 36,000 fewer than the second quarter’s shutdowns.
e pace of exits slowed dramatically by mid-2020, with
the second half of the year experiencing 3percent fewer exits
than the second half of 2019. At that time the composition
of the most aected businesses also began to change. Initial
exits were concentrated among businesses that had suered
most from early COVID restrictions, which were predomi-
nately those in the service sector that relied on face-to-face
customers and that were unable to remold their operations
for a remote environment. In the rst half of 2020 busi-
nesses in leisure and hospitality, education, and health-care
services experienced nearly 70percent more exits than they
had in the rst half of 2019. But, in the second half of 2020,
2. BLS rst reports total establishment closings roughly two quarters aer the
end of each survey period, before retroactively recategorizing those closings
either as reopenings or establishment deaths, depending on whether a busi-
ness had reopened during the four subsequent quarters. For example, the
current BED data release provides data on total closings through the end of
2021, while the subset of establishment deaths is available only through the
rst quarter of 2021.

2 The Hamilton Project • Brookings
the only industries that experienced more exits than in 2019
were information and nancial services, where above-trend
business closings have continued through the end of 2021.
Overall, services accounted for almost 90 percent of total
establishment deaths from the start of 2020 through March
of 2021. is disproportionate impact on the service sector
during the COVID recession contrasts starkly with earlier
recessions.
Meanwhile, the record pace of new business creation
that began in mid-2020 achieved the feat of fully recovering
the number of establishments lost through exits by the end
of 2020. And, through March of 2021, 107,000 more estab-
lishments had been created than had been destroyed since
2019.
3
Shown in Figure 1 as solid green lines, establishment
3. Observed establishment births from BED data in 2020Q1 have been adjusted to
remove a spike in births that were specic to education and health services that
was not present in data vintages prior to the latest BED annual revision. Follow-
births have continued rising in both the goods and service
sectors, to combine for historically high levels of business
creation through the end of 2021. Many of these new births
are among the most pandemic-aected industries that expe-
rienced earlier business exits, including leisure and hospital-
ity, while other new births appear to be in industries that
might have been beneciaries of shis in COVID-era con-
sumption and mobility patterns, such as transportation and
warehousing (see Figure 7 below).
ese results diverge signicantly from the aermath of
the Great Recession, when the rate of new business start-ups
remained depressed for more than a decade: by 2018 the rate
of start-up formation remained 24percent lower than it had
ing Decker and Haltiwanger (2022) the number of establishment births have
been reduced by 36,000 in 2020Q1. However, employment data from births
have not been adjusted. BLS has advised that these data revisions and additional
information will be published with the upcoming 2022Q1 data release.
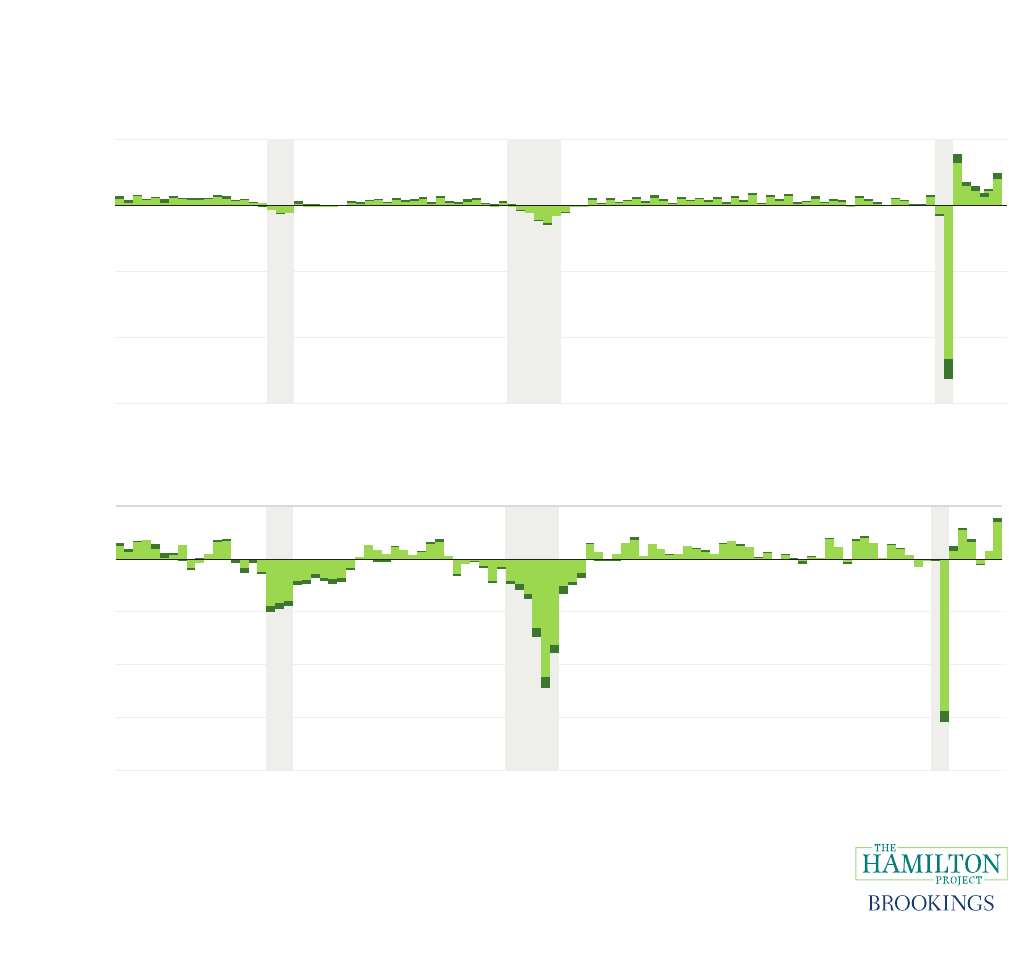
FIGURE 1
Establishment Deaths and Births Relative to Temporary Shutdowns and
Reopenings
50
100
150
200
250
300
350
1997 2000 2003 2006 2009 2012 2015 2018 2021
Number of establishments
(in thousands)
Number of establishments
(in thousands)
Establishment
births
Establishment
deaths
Temporary shutdowns
Reopenings
20
30
40
50
60
70
1997 2000 2003 2006 2009 2012 2015 2018 2021
A. Service Sector
B. Goods Sector
Source: Bureau of Labor Statistics, Business Employment Dynamics (BLS-BED) 1997-2021; authors’ calculations.
Note: Figures present quarterly data for the number of establishment births and reopenings through the end of 2021.
Data on establishment deaths and temporary shutdowns are available only through 2021Q1 due to lagged reclassica-
tion of “total closings,” which are not shown. All data are seasonally adjusted. Gray shading indicates recession peri-
ods. Y-axes for services and goods sectors are shown at different scales.
Tracking the Robust Recovery in the Business Sector Since 2020 3
been in 2006. is lower rate of business formation partially
contributed to the slow economic recovery of the 2010s (Din-
lersoz et al. 2021). As of this writing, business destruction
and creation since 2020 more closely resemble the Dot Com
period. Both recoveries were relatively brief and returned to
positive net establishment growth within the rst year of the
start of the recession. And net business creation was largely
led by service industries early on in each of those recoveries.
Employment Impacts of
COVID Business Churn
While labor markets were initially jolted by the early wave
of business closures, the vast majority of employment losses
by the end of June 2020 stemmed from contractions among
businesses that remained open. First, the establishment
deaths that did occur over the COVID period led to smaller
employment impacts than establishment deaths in prior re-
cession episodes. Based on the ve quarters of available data
through March of 2021, a total of 1.3million establishment
exits resulted in the loss of 3.9 million jobs. Over similar
spans aer the onset of the prior two recessions, the Great
Recession had lost 1.2 million establishments and 4.4 mil-
lion jobs, whereas the 2001 recession lost 1.0 million es-
tablishments and an even greater 5.7million jobs. Second,
the severe contraction of payrolls dwarfs the employment
losses from closed businesses. In the second quarter of 2020,
17.5million (or 86percent of the gross 20.4million jobs lost)
resulted from contractions.
Figure 2 highlights these contributions over time,
showing employment ows driven by expansions net of
FIGURE 2
Employment Contribution of Openings and Expansions Net of Closings and
Contractions (Different Scales)
Net employment flows
(in millions)
Net employment flows
(in millions)
A. Service Sector
B. Goods Sector
-15
-10
-5
0
5
1997 1999 2001 2003 2005 2007 2009 2011 2013 2015 2017 2019 2021
-2.0
-1.5
-1.0
-0.5
0.0
0.5
1997 1999 2001 2003 2005 2007 2009 2011 2013 2015 2017 2019 2021
Expansions less Contractions
Openings less Closings
Source: Bureau of Labor Statistics, Business Employment Dynamics (BLS-BED) 1997-2021; authors’ calculations.
Note: Figures present net quarterly employment ows consolidated into two groups: “Expansions less Contractions” re-
fers to the net of employment gained at expanding establishments, minus employment lost from contracting establish-
ments. “Openings less Closings” refers to employment gained at reopening and newly created establishments, minus
employment lost from establishments closing either permanently or temporarily. All data are seasonally adjusted. Gray
shading indicates recession periods. Y-axes for service and goods sectors are shown at different scales.

4 The Hamilton Project • Brookings
contractions and driven by openings net of closings (with-
out distinguishing between temporary and permanent clos-
ings). As shown by the light green bars, during the initial
second-quarter downturn, employment lost from contract-
ing establishments outweighed gains by expanding estab-
lishments by 11.6 million jobs among service-sector busi-
nesses and another 1.4million jobs among goods producers.
In that same quarter, jobs lost due to closing establishments
outnumbered those gained by reopenings and newly created
establishments by 1.6 million, with services accounting for
1.5 million of those.
Moreover, the large number of jobs initially lost
through contractions had not been fully recovered by the
end of 2021, with payroll expansions remaining 3.1million
jobs short among those same businesses. On the other hand,
the jobs lost through initial establishment closings had been
more than fully recovered by employment gains among re-
openings and newly created businesses. In total through
2021, BED data suggest that nearly 450,000 more establish-
ments had opened than closed since the beginning of 2020,
and that these new businesses had contributed a net 500,000
jobs to the recovery. Alone, births of new businesses created
an average of 1million new jobs in each of the nal three
quarters of 2021, driven mostly by small establishments
(shown in Figure 3).
Business and employment creation have been quite dif-
ferent from what they were in the prior two post-recession
periods. Over a similar two years from the start of the Great
Recession, 250,000 fewer establishments were in operation,
costing the economy nearly 540,000 jobs. Most striking is
the extended employment downturn among goods produc-
ers present in both earlier recessions that the COVID period
FIGURE 3
Employment Contribution of Openings and Expansions Net of Closings and
Contractions (Shared Scales)
Net employment flows
(in millions)
Net employment flows
(in millions)
A. Service Sector
B. Goods Sector
-3
-2
-1
0
1
2
3
4
1997 1999 2001 2003 2005 2007 2009 2011 2013 2015 2017 2019 2021
Expansions less Contractions
Openings less Closings
-11.6 million/
-1.5 million
-3
-2
-1
0
1
2
3
4
1997 1999 2001 2003 2005 2007 2009 2011 2013 2015 2017 2019 2021
Source: Bureau of Labor Statistics, Business Employment Dynamics (BLS-BED) 1997-2021; authors’ calculations.
Note: Figures present net quarterly employment ows consolidated into two groups: “Expansions less Contractions” re-
fers to the net of employment gained at expanding establishments, minus employment lost from contracting establish-
ments. “Openings less Closings” refers to employment gained at reopening and newly created establishments, minus
employment lost from establishments closing either permanently or temporarily. All data are seasonally adjusted. Gray
shading indicates recession periods. Employment ows for service sector in 2020Q2 are not shown to scale.

Tracking the Robust Recovery in the Business Sector Since 2020 5
has largely avoided. For instance, by early 2010, which was
the last quarter of declining employment in the Great Reces-
sion, the goods sector constituted 97percent of the net em-
ployment lost by establishments that had closed since early
2008. Construction employment alone accounted for nearly
60 percent as a result of the housing market’s collapse. In
all, it took until mid-2011, or 14 quarters, for employment
gained from openings in the goods sector to exceed the em-
ployment continuing to be lost from closings. In contrast,
the brief two-quarter COVID downturn saw an immediate
rebound to positive employment growth from net openings
in the third quarter of 2020, largely as a result of reopenings
from earlier shutdowns. And by the fourth quarter of 2021,
reopening and newly created establishments in the goods
sector had more than fully recovered total employment lost
by closings, while the service sector had reached that thresh-
old in the quarter prior.
Employment Flows by Firm Size
Payroll contractions of larger rms largely drove the precip-
itous decline in employment in the second quarter of 2020.
Figure 4 shows employment ows from openings net of clos-
ings and expansions net of contractions for rms with 1–49
employees and rms with 50 or more employees. Nearly
70percent of total second-quarter employment losses came
from larger rms contracting (the dark green bar), where
rms with 250 or more employees accounted for half the to-
tal alone (not shown).
As is typically true (partly due to data construction),
employment eects from rm closings were concentrated
among small businesses, with businesses with 1–49 em-
ployees accounting for 93percent of all workers aected by
closings at the end of June of 2020.
4
ese employment ows
support earlier studies that showed initial closures con-
centrated among smaller businesses, meanwhile shutdown
rates at the largest businesses remained near pre-pandemic
norms (Crane et al. 2022).
Smaller rms have been a key driver of employment
growth throughout the recovery, recovering 96 percent of
their initial loss by the end of 2021, versus 71 percent for
4. Due to the dynamic method used in tabulating BED employment ows by
rm size, which allows movements across size classes, a portion of employ-
ment ows may reect downsizing and growing rms moving across the
50-employee threshold.
FIGURE 4
Employment Contribution by Firm Size
Net employment flows (in millions)
-16
-8
-12
-4
0
4
1997 1999 2001 2003 2005 2007 2009 2011 2013 2015 2017 2019 2021
Expansions less Contractions (1-49 employees)
Expansions less Contractions (50+ employees)
Openings less Closings (1-49 employees)
Openings less Closings (50+ employees)
Source: Bureau of Labor Statistics, Business Employment Dynamics (BLS-BED) 1997-2021; authors’ calculations.
Note: Net quarterly employment ows, split by size of rm, are consolidated into two groups: “Expansions less Contrac-
tions” refers to the net of employment gained at expanding rms, minus employment lost from contracting rms. “Open-
ings less Closings” refers to employment gained at reopening and newly created rms, minus employment lost from rms
closing either permanently or temporarily. All data are seasonally adjusted. Gray shading indicates recession periods.

6 The Hamilton Project • Brookings
larger rms. Encouraging as a sign of business creation,
much of the employment recovery among rms with 1–49
employees has been driven by new establishments and re-
openings (more easily seen in Figure 5). ose gains exceed-
ed total losses from closed businesses by 210,000 since the
beginning of 2020 through the end of 2021. Small business
expansions have also contributed to the employment recov-
ery, as their net expansions of payrolls were responsible for
more than 30 percent of total employment gains in 2021.
Yet, by the end of 2021, expansions among small businesses
had yet to recover roughly 410,000 employees that were ini-
tially lost by contractions, while expansions at rms with
over 50employees had yet to recover more than 3million.
In comparison to past recessions, COVID stands out
due to the the quick recovery of jobs, in particular those con-
tributed by small rms. From the third quarter of 2020 to the
end of 2021, small rms with 1–49 employees accounted for
roughly 40percent of total employment growth, compared
to just 26 percent during the rst four positive quarters of
employment growth following the Great Recession. In this
respect, also, the COVID recovery more resembles the Dot
Com period, during which small rms contributed roughly
40percent of net employment growth. While the brevity of
the COVID downturn is unique in many ways, at the end of
2001 net openings among the smallest rms similarly recov-
ered in just two quarters to contribute positive employment
growth, despite continued employment losses in larger rms
and contracting small rms.
Employment and Job Openings
by Establishment Size
Additional data on employment and job openings by es-
tablishment size, rather than at the rm level, help provide
insight into which types of businesses were initially most
aected—and more recently, which types are seeking to ex-
pand through hiring. Figure 6a, displaying data from the Job
Openings and Labor Turnover Survey (JOLTS), shows the
cumulative change in employment since February 2020 by
establishment size. Note that in these data, multiple smaller
establishments with common ownership under parent rms
can be reported as individual establishments with 1–49 em-
ployees, whereas in BED data discussed above, those estab-
lishments would be aggregated as one larger rm.
FIGURE 5
Employment Contribution by Firm Size (Truncated Scale)
Net employment flows (in millions)
Expansions less Contractions (1-49 employees)
Expansions less Contractions (50+ employees)
Openings less Closings (1-49 employees)
Openings less Closings (50+ employees)
-4
-2
0
2
4
1997 1999 2001 2003 2005 2007 2009 2011 2013 2015 2017 2019 2021
-10.5m
-3.6m
-0.1m
-1.1m
Total: -15.3m
Source: Bureau of Labor Statistics, Business Employment Dynamics (BLS-BED) 1997-2021; authors’ calculations.
Note: Net quarterly employment ows, split by size of rm, are consolidated into two groups: “Expansions less Con-
tractions” refers to the net of employment gained at expanding rms, minus employment lost from contracting rms
“Openings less Closings” refers to employment gained at reopening and newly created rms, minus employment lost
from rms closing either permanently or temporarily. All data are seasonally adjusted. Gray shading indicates recession
periods. Employment ows in 2020Q2 are not shown to scale.

Tracking the Robust Recovery in the Business Sector Since 2020 7
Initially, the smallest establishments bore the brunt of
the employment downturn, losing 56 percent of the total
17.9 million cumulatively lost jobs from January through
April 2020.
5
When considered in conjunction with the data
on rm size shown in Figure 4, an outsize number of job
losses appears to have come from smaller establishments
with common ownership under larger rms. In JOLTS data,
those smaller establishments have also been faster than
larger establishments to recover employment; this suggests
a high rate of hiring by those businesses, some of which was
likely enabled by larger parent rms.
Seen in Figure 6b, available job openings are histori-
cally high across all sizes of establishments. And while it is
true that the smallest businesses typically account for a large
share of job openings, the nearly 5million postings shown
in June 2022 are particularly striking given the apparent
recovery of employment among those smallest businesses.
5. e JOLTS methodology assigns establishment size classes according to the
maximum employment of surveyed businesses over the previous 12months.
is classication remains xed for a year until the next annual sample is
drawn. is diers from other sources of monthly employment by establish-
ment size, including ADP, which captures employment sizes in monthly
survey periods and weights employment by industry and size based on
interpolations of annual employment-share benchmarks. For this reason,
we present JOLTS data as our preferred proxy of employment change across
initial establishment sizes.
Of interest will be how hiring trends continue across busi-
ness sizes, since openings seem to have recently fallen most
among establishments with 50 or more workers.
Growth in New Business
Creation
Applications to start new businesses took o almost imme-
diately at the beginning of the pandemic, reaching 4.4mil-
lion new business applications led in 2020, almost 900,000
more than had been led in 2019. In all, from the start of
2020 through June 2022, total applications for new busi-
nesses are up almost 40 percent over pre-pandemic trend,
while those that the Census Bureau deems as high propen-
sity, or likely to result in an employer business, are nearly
30percent higher.
6
rough 2021 those applications appear
6. We focus on high-propensity applications of likely employer businesses
because these correspond more closely to the measure of establishment
births in BED data. Applications for likely non-employer businesses, such
as sole proprietorships, have also been elevated since 2020. However, those
applications provide less of a signal for future economic growth and can
be inuenced by factors such as tax policy. For example, some researchers
explore whether non-employer applications were boosted by people looking
to qualify for benets provided by the Paycheck Protection Program, although
those researchers nd what was at most a modest eect. For discussion, see
Haltiwanger (2022) and Bungton et al. (2021).
FIGURE 6
Cumulative Employment and Job Openings by Establishment Size
A. Employment Change Relative to February 2020 B. Job Openings Relative to History
Feb.
2020
Sep.
2020
Apr.
2021
Nov.
2021
Jun.
2022
Employment change (in millions)
2000 2003 2006 2008 2011 2014 2016 2019 202
2
Job openings (in millions)
-20
-15
-10
-5
0
5
1 to 49 employees
50 to 249
employees
250+ employees
0
1
2
3
4
5
6
1 to 49 employees
50 to 249 employees
250+ employees
Source: Bureau of Labor Statistics, Job Openings and Labor Turnover Survey (BLS-JOLTS) 2022; authors’ calculations.
Note: Panel A shows cumulative employment changes from February 2020 through June 2022 by establishment em-
ployment size, where monthly changes in employment are measured as hiring net of total separations. Panel B shows
the full JOLTS timeseries of job openings across establishment sizes beginning in December 2000 and running through
June 2022. All data are seasonally adjusted. Gray shading indicates recession periods.

8 The Hamilton Project • Brookings
to have translated to near-record levels of business creation.
Figure 7 plots high-propensity business applications against
establishment births by industry, each relative to their 2018–
19 trend, cumulating those numbers from the second half of
2020 through 2021.
7
New business applications among the most pandemic-
aected service industries have risen more than actual es-
tablishment births. Across leisure and hospitality, retail, and
other generally personal services, high-propensity applica-
tions from the third quarter of 2020 through 2021 were cu-
mulatively 41percent over pre-pandemic trends, while es-
tablishment births were only 9 percent above trend. To be
sure, the opening of a new employer business typically lags
7. Note that BFS high-propensity applications are based on characteristics for
new rms, while BED measures births of establishments, which can include
new establishments created by existing rms. We rely on BED data for its
timeliness; the most recent data release covers 2021Q4 at the time of publica-
tion. e Census Bureau’s Business Dynamics Statistics is the primary admin-
istrative data source for rm-level dynamics, but is released on a signicant
lag and available only through 2019. Haltiwanger (2022) shows the cumulative
impulse response to an innovation in high-propensity applications on estab-
lishment births to be signicant and increasing through 12 quarters.
an application, and births may still yet rise strongly in com-
ing quarters.
In contrast, applications in the industries of informa-
tion, transportation and warehousing, and professional and
businesses services have more quickly translated to elevat-
ed business creation. ose applications were a cumulative
49percent above trend and had resulted in 27percent more
establishment births by the end of 2021. ese represent a
large portion of business activity responding to new op-
portunities amid the pandemic, as demand rose for certain
business services, logistics, and technologies as people and
rms quickly shied to a remote environment.
e industry composition of new business applica-
tions also changed over the course of the pandemic. Early
on, applications for new businesses were tilted toward the
most pandemic-aected service industries, with high-pro-
pensity applications 45percent above trend from mid-2020
through mid-2021. However, applications ultimately trailed
o in these industries, falling to 29 percent above trend from
mid-2021 to mid-2022. Meanwhile applications in infor-
mation, transportation and warehousing, and professional
FIGURE 7
Comparing the Increase in Establishment Births to High-Propensity
Business Applications, 2020Q3–2021Q4
Construction
Education and health
Financial activities
Information
Leisure and hospitality
Manufacturing
Natural resources and mining
Other services
Professional and business services
Retail trade
Transportation and warehousing
Wholesale trade
-10
0
10
20
30
40
50
0 10 20 30 40 50 60 70 80
Percent increase in establishment births
(relative to trend)
Percent increase in high-propensity business applications (relative to trend)
Source: Bureau of Labor Statistics, Business Employment Dynamics (BLS-BED) 2018-2021; Census Bureau, Business
Formation Statistics (Census-BFS) 2018–2021; authors’ calculations.
Note: Plotted on the y-axis is the percentage increase in the total number of establishment births from 2020Q3 to
2021Q4 relative to what would have occurred if births had continued at 2018Q1 to 2019Q4 trend rates. Similarly, plot-
ted on the x-axis is the percentage increase in the total number of recent high-propensity business applications relative
to the 2018Q1 to 2019Q4 trend.

Tracking the Robust Recovery in the Business Sector Since 2020 9
and businesses services—a group more oriented around the
changes brought about by remote work—have continued to
increase, rising from 47percent above trend through mid-
2021 to 49percent above trend in the most recent period.
Underlying this shi may be changing motivations of
new entrepreneurs. A survey of new business owners from
Gusto (a payroll and human-resources platform) found that
35 percent of new business owners in 2020 cited previous
job layos as their top reason for starting a business. at is
consistent with previous business cycles during which busi-
ness creation accelerated toward the end of economic down-
turns as labor market opportunities remained constrained.
Similarly, early research has shown greater business forma-
tion in 2020 in states that faced greater job loss (Djankov
and Zhang 2021). By 2021, however, only 14percent of new
business owners cited previous job layos as their top rea-
son for starting a business, while roughly 25percent cited
pandemic-related business opportunities as their motiva-
tion (Pardue 2022).
Many of these recently created employer businesses also
appear to be somewhat smaller in size than new births in
2018 and 2019. Figure 8 compares employment per birth
ratios of recently created establishments to pre-pandemic
ratios. ese data suggest that newly created businesses are
beginning with fewer employees in all industries except for
transportation and warehousing. Although information
businesses registered record high establishment births that
far exceeded even the boom in this sector in the Dot Com
run-up, the average of 2.1 jobs created per birth was signi-
cantly below the average of 2.7 from 2018 and 2019. Simi-
larly, new businesses in leisure and hospitality and retail
trade are smaller on average by 1.7 and 0.8 workers, respec-
tively. ese results so far t the historical picture of new
businesses born in recession periods, which tend to remain
smaller and hire fewer employees over their lives (Sedláček
and Sterk 2017). In contrast, hiring at new manufacturing
and construction establishments has been much closer to
pre-pandemic rates through 2021.
Conclusion
e relatively quick rebound of the business sector was
due in large part to the unique nature of the COVID reces-
sion, with its abrupt shutdown and then reopening of the
FIGURE 8
Ratio of Employment per Establishment Birth by Industry, 2020Q3–2021Q4
Compared to Pre-Pandemic
Pre-pandemic: Employment per birth
Construction
Education and health
Financial activities
Information
Leisure and hospitality
Manufacturing
Natural resources and mining
Other services
Professional and business services
Retail trade
Transportation and warehousing
Wholesale trade
1.0
2.0
3.0
4.0
5.0
6.0
7.0
8.0
1.0 2.0 3.0 4.0 5.0 6.0 7.0 8.0 9.0 10.0
COVID Recovery: Employment per birth
45⁰ Slope
Source: Bureau of Labor Statistics, Business Employment Dynamics (BLS-BED) 2018-2021; authors’ calculations.
Note: Plotted on the y-axis is the ratio of gross employment created by establishment births divided by the number
of establishment births measured cumulatively from 2020Q3 to 2021Q4. Similarly, plotted on the x-axis is the ratio of
gross employment per establishment birth measured cumulatively from 2018Q1 to 2019Q4. Industries beneath the
45-degree line indicate smaller employment per birth in the recent period than in the pre-pandemic period.
10 The Hamilton Project • Brookings
economy. Aer an unprecedented number of businesses
temporarily shut down in 2020, a majority were able to re-
open in the year that followed. Since that time, the pace of
new business formation has exceeded any period in recent
memory and has helped propel the recoveries in employ-
ment and in the number of active establishments. is re-
port nds that the recovery of the business sector overall
masks considerable restructuring of business activities, both
among service-sector industries that were most exposed to
early COVID lockdowns and among industries responding
to new demand for certain products and services amid the
pandemic. e implications of these dynamics for future
job creation and productivity growth are unclear and will
depend on whether the new businesses, given their focus
and structure, remain viable as the economy continues to
recover.
e role of policy supports during the COVID period
also bears emphasis. Enormous scal support for house-
holds in 2020 and 2021 through expanded unemployment
insurance and checks to households helped to support con-
sumer demand and make business creation possible (Fazio
et al. 2021; Ganong et al. 2022; Gelman and Stephens 2022).
In contrast, evidence of the ecacy of pandemic business-
support programs, including the Paycheck Protection Pro-
gram, is mixed. A review of those programs nds that most
support went to businesses that would not have changed
employment even in the absence of the program. Much of
the same impact on business survival could have been ac-
complished in a more cost-eective manner by better target-
ing businesses that were most in danger of contracting or
failing, which are oen the smallest businesses that lack the
same access to capital that larger rms enjoy (Chodorow-
Reich, Iverson, and Sunderam 2022).
Together, those factors helped to stimulate the business
activity that has helped propel the ongoing recovery from
the COVID recession. Prior to the pandemic, the United
States had experienced decades-long declines across various
measures of business and labor market dynamism. Rates
of business start-ups and the share of employment at those
start-ups had each been cut in half since the mid-1980s,
while worker rm-switching was also at multi-decade lows
(Lettieri and Fikri 2022). Some initially worried that the ex-
pected rise in business exits and slowed rm entry, which
typically accompany economic downturns, would further
worsen competition and business dynamism (Rose 2020).
is report shows how the business sector deed those ex-
pectations and has provided new opportunities for workers
and capital to be redirected toward more-productive and
higher-growth areas.
e Hamilton Project has released multiple policy pro-
posals to foster a more dynamic and productive business
sector, proposals that aim to promote economic growth and
expand economic opportunity. Enhancing healthy compe-
tition across the business sector is central to these policy
goals, since many industries show record levels of concen-
tration among incumbent rms (Shambaugh et al. 2018).
In particular, policymakers should rescind policies that
eectively stie the ability of workers to switch rms and the
ability of new rms to enter markets, such as noncompete
contracts and occupational licensing requirements (Krueger
and Posner 2018; Nunn 2018, 2021). Alleviating these re-
straints boosts productivity and wage growth (Shambaugh,
Nunn, and Liu 2018). As policymakers turn from scal sup-
port to longer-term economic strategy, the implementation
of creative policy ideas to bolster the economy’s dynamic
foundations will both increase economic growth and cause
those gains to be widely shared (Chatterji 2018; Gans 2018;
Moss, Nunn, and Shambaugh 2020).
References
“All Over the Rich World, New Businesses Are Springing to Life.”
2022. e Economist, April 23, 2022.
Bungton, Catherine, Daniel Chapman, Emin Dinlersoz, Lucia
Foster, and John Haltiwanger. 2021. “High-frequency
data from the U.S. Census Bureau during the COVID-19
pandemic: small vs. new businesses.” Business Economics
56: 155–167.
Bureau of Labor Statistics (BLS). 1997-2021. “Business Employ-
ment Dynamics (BED).” Bureau of Labor Statistics, U.S.
Department of Labor, Washington, DC. Accessed August
5th, 2022.
———. 2022. “Job Openings and Labor Turnover Survey
(JOLTS).” Bureau of Labor Statistics, U.S. Department of
Labor, Washington, DC. Accessed August 5th, 2022.
Chatterji, Aaron. 2018. “e Main Street Fund: Investing in an
Entrepreneurial Economy.” e Hamilton Project, Brook-
ings Institution, Washington, DC.
Chodorow-Reich, Gabriel, Ben Iverson, and Adi Sunderam.
2022. “Lessons Learned from Support to Business during
COVID-19.” e Hamilton Project, Brookings Institution,
Washington, DC.
Crane, Leland, Ryan Decker, Aaron Flaaen, Adrian Hamins-Puer-
tolas, and Christopher Kurz. 2022. “Business exit during
the COVID-19 pandemic: Non-traditional measures in
historical context.” Journal of Macroeconomics 72 (103419).
Decker, Ryan, and John Haltiwanger. 2022. “Business entry and
exit in the COVID-19 pandemic: A preliminary look at
ocial data.” FEDS Notes, Board of Governors of the Fed-
eral Reserve System, Washington, DC.
Dinlersoz, Emin, Timothy Dunne, John Haltiwanger, and Veron-
ika Penciakova. 2021. “Business Formation: A Tale of Two
Recessions.” AEA Papers and Proceedings 111: 253–257.
Djankov, Simeon, and Eva Zhang. 2021. “Startups in the United
States during the pandemic reect some dynamism amid
job losses.” Policy Brief, Peterson Institute for Interna-
tional Economics, Washington, DC.
Fazio, Catherine, Jorge Guzman, Yupeng Liu, and Scott Stern.
2021. “How is COVID Changing the Geography of
Entrepreneurship? Evidence from the Startup Cartogra-
phy Project.” Working Paper 28787, National Bureau of
Economic Research, Cambridge, MA.
Ganong, Peter, Fiona Greig, Pascal Noel, Daniel M. Sullivan, and
Joseph Vavra. 2022. “Lessons Learned from Expanded
Unemployment Insurance During COVID-19.” e Ham-
ilton Project, Brookings Institution, Washington, DC.
Tracking the Robust Recovery in the Business Sector Since 2020 11
Gans, Joshua. 2018. “Enhancing Competition with Data and
Identity Portability.” e Hamilton Project, Brookings
Institution, Washington, DC.
Gelman, Michael, and Melvin Stephens Jr. 2022. “Lessons Learned
from Economic Impact Payments During COVID-19.” e
Hamilton Project, Brookings Institution, Washington, DC.
Haltiwanger, John. 2022. “Entrepreneurship during the CO-
VID-19 Pandemic: Evidence from the Business Formation
Statistics.” In Entrepreneurship and Innovation Policy and
the Economy, Volume 1, edited by Josh Lerner and Scott
Stern. 9-42. University of Chicago Press, Chicago, IL.
Krueger, Alan, and Eric Posner. 2018. “A Proposal for Protecting
Low-Income Workers from Monopsony and Collusion.”
e Hamilton Project, Brookings Institution, Washing-
ton, DC.
Lettieri, John, and Kenan Fikri. 2022. “e Case for Economic
Dynamism and Why It Matters for the American Work-
er.” Economic Innovation Group, Washington, DC.
Moss, Emily, Ryan Nunn, and Jay Shambaugh. 2020. “e
Slowdown in Productivity Growth and Policies at Can
Restore It.” e Hamilton Project, Brookings Institution,
Washington, DC.
Nunn, Ryan. 2018. “How Occupational Licensing Matters for
Wages and Careers.” e Hamilton Project, Brookings
Institution, Washington, DC.
———. 2021. “Removing Policy Obstacles to Competitive Labor
Markets.” Blog. e Hamilton Project, Brookings Institu-
tion, Washington, DC. July 13, 2021.
Pardue, Luke. 2022. “Survey: Entrepreneurs Seizing New Business
Opportunities Amid the Great Resignation.” Company
News. Gusto, Washington, DC. June 23, 2022.
Rose, Nancy. 2020. “Will Competition Be Another COVID-19
Casualty?” e Hamilton Project, Brookings Institution,
Washington, DC.
Sedláček, Pter, and Vincent Sterk. 2017. “e Growth Potential of
Startups over the Business Cycle.” American Economic
Review 107 (10): 3182-3210.
Shambaugh, Jay, Ryan Nunn, Audrey Breitwieser, and Patrick Liu.
2018. “e State of Competition and Dynamism: Facts
about Concentration, Start-Ups, and Related Policies.” e
Hamilton Project, Brookings Institution, Washington, DC.
Shambaugh, Jay, Ryan Nunn, and Patrick Liu. 2018. “How Declin-
ing Dynamism Aects Wages.” e Hamilton Project,
Brookings Institution, Washington, DC.
US Census Bureau. 2018–22. “Business Formation Statistics
(BFS).” US Census Bureau, Suitland, MD. Accessed Au-
gust 2nd, 2022.
———. 2020. “Small Business Pulse Survey.” US Census Bureau,
Suitland, MD. Accessed August 2nd, 2022.

ADVISORY COUNCIL
STEPHANIE AARONSON
Vice President and Director,
Economic Studies;
Senior Fellow, Economic Studies,
The Brookings Institution
GEORGE A. AKERLOF
University Professor,
Georgetown University
ROGER C. ALTMAN
Founder and Senior Chairman,
Evercore
KAREN L. ANDERSON
Senior Director of Policy & Communications,
Becker Friedman Institute for
Research in Economics,
The University of Chicago
ALAN S. BLINDER
Gordon S. Rentschler Memorial Professor of
Economics and Public Affairs,
Princeton University;
Nonresident Senior Fellow,
The Brookings Institution
STEVEN A. DENNING
Chairman,
General Atlantic
JOHN M. DEUTCH
Institute Professor,
Massachusetts Institute of Technology
CHRISTOPHER EDLEY, JR.
Co-Founder and President Emeritus,
The Opportunity Institute
BLAIR W. EFFRON
Partner,
Centerview Partners LLC
DOUGLAS W. ELMENDORF
Dean and Don K. Price Professor of
Public Policy,
Harvard Kennedy School
JUDY FEDER
Professor and Former Dean,
McCourt School of Public Policy,
Georgetown University
JASON FURMAN
Aetna Professor of the Practice of
Economic Policy, Harvard University;
Senior Fellow, Peterson Institute for
International Economics;
Senior Counselor, The Hamilton Project
MARK T. GALLOGLY
Cofounder and Managing Principal,
Centerbridge Partners, L.P.
TED GAYER
President,
Niskanen Center
TIMOTHY F. GEITHNER
President, Warburg Pincus;
Senior Counselor, The Hamilton Project
ROBERT GREENSTEIN
Visiting Fellow, The Hamilton Project,
Economic Studies, The Brookings Institution;
Founder and President,
Center on Budget and Policy Priorities
MICHAEL GREENSTONE
Milton Friedman Professor in
Economics and the College,
Director of the Becker Friedman Institute for
Research in Economics, and
Director of the Energy Policy Institute,
University of Chicago
GLENN H. HUTCHINS
Chairman, North Island and
North Island Ventures
LAWRENCE F. KATZ
Elisabeth Allison Professor of Economics,
Harvard University
MELISSA S. KEARNEY
Neil Moskowitz Professor of Economics,
University of Maryland;
Director, Aspen Economic Strategy Group;
Nonresident Senior Fellow,
The Brookings Institution
LILI LYNTON
Founding Partner,
Boulud Restaurant Group
HOWARD S. MARKS
Co-Chairman,
Oaktree Capital Management, L.P.
KRISTON MCINTOSH
Managing Director,
Hamilton Place Strategies
ERIC MINDICH
Founder,
Everblue Management
DAMBISA MOYO
Co-Principal,
Versaca Investments
SUZANNE NORA JOHNSON
Former Vice Chairman,
Goldman Sachs Group, Inc.;
Co-Chair,
The Brookings Institution
PETER ORSZAG
CEO, Financial Advisory,
Lazard Freres & Co LLC
RICHARD PERRY
Managing Partner & Chief Executive Ofcer,
Perry Capital
PENNY PRITZKER
Chairman and Founder, PSP Partners;
38th Secretary of Commerce
MEEGHAN PRUNTY
Principal,
PE Strategic Partners
ROBERT D. REISCHAUER
Distinguished Institute Fellowand
President Emeritus,
Urban Institute
NANCY L. ROSE
Charles P. Kindleberger Professor of
Applied Economics,
Massachusetts Institute of Technology
DAVID M. RUBENSTEIN
Co-Founder and Co-Chairman,
The Carlyle Group
ROBERT E. RUBIN
Former U.S. Treasury Secretary;
Co-Chair Emeritus,
Council on Foreign Relations
LESLIE B. SAMUELS
Senior Counsel,
Cleary Gottlieb Steen and Hamilton LLP
SHERYL SANDBERG
Chief Operating Ofcer,
Facebook
DIANE WHITMORE SCHANZENBACH
Margaret Walker Alexander Professor and
Director, The Institute for Policy Research,
Northwestern University;
Nonresident Senior Fellow,
The Brookings Institution
STEPHEN SCHERR
Chief Executive Ofcer,
Goldman Sachs Bank USA
RALPH L. SCHLOSSTEIN
President and Chief Executive Ofcer,
Evercore
ERIC SCHMIDT
Former CEO and Chariman, Google;
Co-Founder, Schmidt Futures
ERIC SCHWARTZ
Chairman and CEO,
76 West Holdings
JAY SHAMBAUGH
Professor of Economics and International Affairs,
The George Washington University
THOMAS F. STEYER
Business Leader and Philanthropist;
Founder,
NextGen America
MICHAEL R. STRAIN
Director of Economic Policy Studies and
Arthur F. Burns Scholar in Political Economy,
American Enterprise Institute
LAWRENCE H. SUMMERS
Charles W. Eliot University Professor,
Harvard University
LAURA D’ANDREA TYSON
Distinguished Professor of the Graduate School,
University of California, Berkeley
DAVID WEIL
Co-President,
Charles and Lynn Schusterman Family
Philanthropies
WENDY EDELBERG
Director

WWW.HAMILTONPROJECT.ORG
1775 Massachusetts Ave., NW
Washington, DC 20036
(202) 797-6484
Printed on recycled paper.
Establishment Deaths and Births Relative to Temporary Shutdowns
and Reopenings
50
100
150
200
250
300
350
1997 2000 2003 2006 2009 2012 2015 2018 2021
Number of establishments
(in thousands)
Number of establishments
(in thousands)
Establishment
births
Establishment
deaths
Temporary shutdowns
Reopenings
20
30
40
50
60
70
1997 2000 2003 2006 2009 2012 2015 2018 2021
A. Service Sector
B. Goods Sector
Source: Bureau of Labor Statistics, Business Employment Dynamics (BLS-BED) 1997-2021; authors’ calcula-
tions.
Note: Figures present quarterly data for the number of establishment births and reopenings through the end
of 2021. Data on establishment deaths and temporary shutdowns are available only through 2021Q1 due to
lagged reclassica tion of “total closings,” which are not shown. All data are seasonally adjusted. Gray shading
indicates recession periods. Y-axes for services and goods sectors are shown at different scales.
A Hamilton Project analysis of the business sector over the COVID-19 period nds that, despite initial fears of
widespread failure, existing businesses and new entrepreneurship have deed earlier expectations, ending 2021
with nearly 450,000 more establishments in operation than prior to the pandemic.
Underneath these aggregate results, patterns across industries reveal evidence of considerable economic
restructuring. A large share of new business creation has occurred in the industries most exposed to the pan-
demic downturn, primarily face-to-face services like restaurants. Other new business activity, such as online
retail and data services, reect new opportunities in the transition to a more remote environment. is report
also traces the employment implications of this churn to uncover the impacts of initial employment losses and
recent recovery across businesses of varying sizes. While questions remain around the contribution of these
new dynamics to job creation and productivity, the persistence of these shis and the resiliency of small busi-
nesses will play key roles in determining the path of the recovery moving forward.
