
Using the Psychological Commitment
to Team (PCT) Scale to Segment Sport
Consumers Based on Loyalty
Daniel F. Mahony, University of Louisville
Robert Madrigal and Dennis Hovk'ard, University of Oregon
Abstract
The purpose of this study was to de-
velop a psychological commitment
to team (PCT) scale to be used in
segmenting sport consumers based
on loyalty. Previous research on the
loyalty construct suggested the im-
portance of using both behavioral
and attitudinal measures when at-
tempting to assess the loyalty of
consumers (Backman & Crompton,
1991a;
Day, 1969). Although mea-
sures of behavioral loyalty are
read-
ily available in team sports
(e.g.,
at-
tendance, television viewing), no
appropriate measure of attitudinal
loyalty was available prior to the
- current study. A number of statisti-
cal procedures and four separate
data collections were used to assess
' the strength of the PCT scale. The
PCT scale provides sport marketers
with a reliable and valid measure-
ment tool for differentiating con-
sumers into discrete segments based
on the strength of their overall loy-
Daniel
F.
Mahony
is an
assistant
professor
vv/f/? the Department of
HPES
at the University of
Louisville.
Robert Madrigal
is an
assistant
professor with the Department of
Marketing in the Lundquist College
of
Business
at the University of
Oregon.
Dennis
Howard
is
a
professor
with the Department of Marketing
in the Lundquist
College
of
Busi-
ness
at the University of
Oregon.
alty. Alternative strategies for
strengthening fan allegiance for
each of the different loyalty seg-
ments are provided.
***
"Marriages come and go. So
do jobs, hometowns, friend-
ships.
But a guy's attachment
to a sports team? There's a
bond that holds the heart."
The preceding statement on fans'
obsession with sports teams ap-
peared recently as the lead sen-
tence in a feature article in USA
Today,
the United States' largest
daily newspaper (Eisler, 1997). The
quote captures the fanaticism or in-
tense partisanship that Guttmann
taled $8.8 billion, an increase of
126%
over the $3.9 billion spent in
1990 (National Sporting Goods As-
sociation,
1996). Although fans'
time and monetary investments in
sports seem to have grown expo-
nentially in recent
years,
it is impor-
tant to recognize that not all those
who watch or attend sporting
events are fans committed to the
teams they view. Zillman and
Paulus (1993) characterized
specta-
tors as
individuals who watch a
game but then forget about the ex-
perience once it is over, whereas
Sloan (1989) said a fan is one who
watches as an enthusiastic devotee.
The Concept of Fan Loyalty
Although the notion of loyalty to
team extends back to antiquity (Lee,
Although fans' time and monetary investments in sports seem
to have grown exponentially in recent years, it is important to
recognize that not all those who watch or attend sporting
events are fans committed to the teams they view.
(1986) uses to define fans as "emo-
tionally committed consumers of
sporting events" (p. 6). The atten-
tion given to sport by hard-core fans
and other spectators is well docu-
mented.
Americans buy almost 200
million tickets to attend professional
and collegiate sporting events each
year (U.S. Bureau of
Census,
1993),
spending about $5 billion annually
for admission (Bureau of Economic
Analysis, 1996). In 1996, the retail
sales of products bearing the trade-
mark or logo of teams in the four
major professional sports leagues in
the United States and Canada to-
1983), very little is known about the
social-psychological factors that
produce strong emotional attach-
ment to sports teams or organiza-
tions.
Previous research outside the
sport-fan literature has shown that
individuals who are emotionally in-
volved devotees to a particular
product or service are far more
likely to repurchase that product or
service and to evaluate the brand or
experience more positively
(e.g.,
Havitz & Howard, 1995). Smith,
Patterson,
Williams, and Hogg
(1981) found the same relationship
extended to sport
fans.
Although not
m
O
m
Z
o
Volume 9 • Number
1
• 2000 • Sport Marketing Quarterly 15
addressing the concept of loyalty
directly, their study of avid sport
fans found that "deeply committed
fans"
displayed a much greater
propensity to watch and attend
sporting events featuring their fa-
vorite teams. More recently, Wake-
field and Sloan (1995) concluded
that "team loyalty," defined as en-
during allegiance to a particular
team,
was the most important factor
in determining spectators' desire to
attend live sporting events.
Although there are many behav-
iors that may be an expression of
fan loyalty
(e.g.,
television viewing,
radio listening, team merchandise
purchases), prior research has relied
heavily on attendance data to mea-
sure fan loyalty to sports teams.
Total attendance
(e.g.,
Baade &
Tiehan,
1990), increases in ticket
sales
(e.g.,
Howard & Crompton,
1995), and the extent of repeat at-
tendance
(e.g.,
Mullin, Hardy, &
Sutton,
1993) have been used as
behavioral indicators of consumers'
loyalty to a sports team or organiza-
tion.
Mullin and his associates
demonstrated the potency of repeat
patronage, confirming the applica-
tion of the "80-20 principle" (Evans
& Berman, 1994) to sports teams. In
their analysis of season attendance
at Pittsburgh Pirates games, Mullin
et al. found that 80% of the in-
crease in ticket sales from one sea-
son to another was produced by
20%
of the existing attendees' buy-
ing more tickets. Although repeat
attendance may be the most evident
manifestation of a person's attach-
ment to a team, this strictly behav-
ioral indicator ignores the underly-
ing psychological processes
explaining why some people attend
more games over time.
In fact, research has shown atten-
dance alone is a poor measure of
loyalty. Murrell and Dietz (1992)
found individuals' support for a par-
ticular team may be strong regard-
less of actual attendance. Backman
and Crompton (1991a) identified
several factors explaining why
strictly behavioral or "observable"
measures like attendance are inade-
quate indicators of loyalty. They
contend that "behavioral measures
do not discriminate between pur-
chasing based on habit or lack of
convenient opportunities" (p. 206).
For example, an NFL fan in
Nashville, Tennessee, may attend
Tennessee Titans games because
there are no other professional foot-
ball options in the area, and he or
she may not necessarily be a com-
mitted fan of the Titans. Therefore,
"true"
loyalty exists only when the
consumer regularly purchases the
product or service and also displays
a strong, positive attitude toward a
specific brand (Day, 1969).
Loyalty as a
Two-Dimensional Construct
The multidimensional nature of loy-
alty has long been of interest to
brand loyalty researchers. In order
to provide a focus for this research,
Olson and Jacoby (1971) developed
a six-point definition of brand loy-
alty, which is now widely cited.
Their definition, later restated
slightly by Jacoby and Kyner (1973),
states that brand loyalty is "(1) a bi-
ased
(i.e.,
nonrandom), (2) behav-
ioral response
(i.e.,
purchase) (3) ex-
pressed over time (4) by some
decision making unit (5) with re-
spect to one or more alternative
brands (6) as a function of psycho-
logical (decision making, evaluate)
processes" (p. 2). Although Jacoby
and Kyner (1973) focused on testing
all six of the elements, most of the
Although repeat attendance may be the most evident manifes-
tation of a person's attachment to a team^ this strictly behav-
ioral indicator ignores the underlying psychological processes
explaining why some people attend more games over time.
In fact, research has shown attendance alone is a poor
measure of loyalty.
loyalty research has focused primar-
ily on two main dimensions, behav-
ioral and attitudinal
(e.g.,
Backman
& Crompton,
1991
a,
1991
b; Jacoby
& Chestnut, 1978). Although Day
(1969) was the first to propose a
two-dimensional conceptualization
of loyalty integrating both behav-
ioral and attitudinal components,
later research provided empirical
evidence that consumer loyalty was
in fact composed of these two sepa-
rate but related elements
(e.g.,
Backman & Crompton, 1991a,
1991b; Olson & Jacoby, 1971).
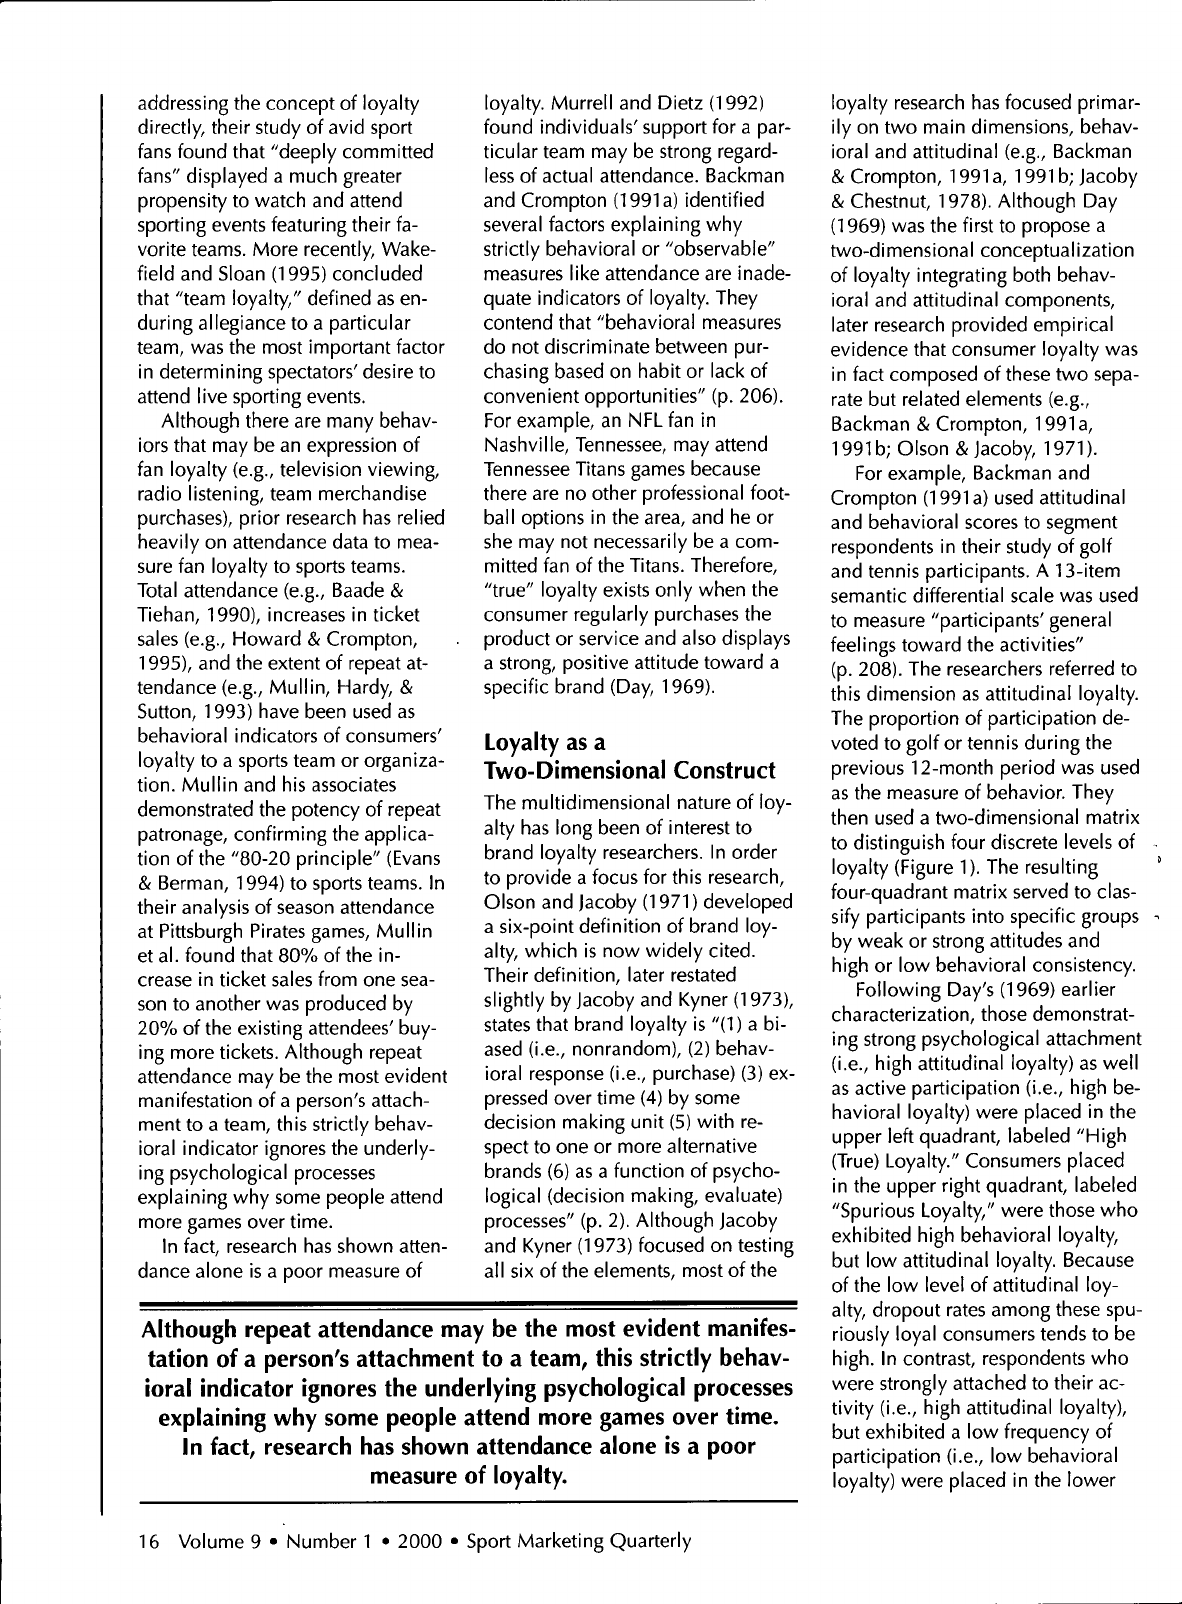
For example, Backman and
Crompton (1991a) used attitudinal
and behavioral scores to segment
respondents in their study of golf
and tennis participants. A 13-item
semantic differential scale was used
to measure "participants' general
feelings toward the activities"
(p.
208). The researchers referred to
this dimension as attitudinal loyalty.
The proportion of participation de-
voted to golf or tennis during the
previous 12-month period was used
as the measure of behavior. They
then used a two-dimensional matrix
to distinguish four discrete levels of
loyalty (Figure 1). The resulting '
four-quadrant matrix served to clas-
sify participants into specific groups ^
by weak or strong attitudes and
high or low behavioral consistency.
Following Day's (1969) earlier
characterization, those demonstrat-
ing strong psychological attachment
(i.e.,
high attitudinal loyalty) as well
as active participation
(i.e.,
high be-
havioral loyalty) were placed in the
upper left quadrant, labeled "High
(True) Loyalty." Consumers placed
in the upper right quadrant, labeled
"Spurious Loyalty," were those who
exhibited high behavioral loyalty,
but low attitudinal loyalty. Because
of the low level of attitudinal loy-
alty, dropout rates among these spu-
riously loyal consumers tends to be
high.
In contrast, respondents who
were strongly attached to their ac-
tivity
(i.e.,
high attitudinal loyalty),
but exhibited a low frequency of
participation
(i.e.,
low behavioral
loyalty) were placed in the lower
16 Volume 9 • Number
1
• 2000 • Sport Marketing Quarterly

Psychological Commitment
Strong Weak
High
Behavioral
Consistency
(Attendance
Frequency)
Low
High (True)
Loyalty
Latent
Loyalty
Spurious
Loyalty
Low (Non)
Loyalty
Figure 1. Loyalty Model
left quadrant, labeled "Latent Loy-
alty." Latently loyal consumers often
express a strong desire to partici-
pate,
but may lack the means
(e.g.,
time,
money, equipment) to engage
in the activity on a regular, ongoing
basis.
Finally, those in the lower
right quadrant, or "Low Loyalty"
segment, were respondents who ex-
hibited low levels of both behav-
ioral and attitudinal loyalty.
Backman and Crompton (1991b)
advanced the understanding of loy-
alty in a sport and leisure context in
two important ways. First, their
two-dimensional approach
reaf-
firmed and extended Day's (1969)
claim that any measure of a per-
son's commitment to a brand or, in
the case of Backman and Cromp-
ton's work, a sport "activity" must
take into account the individual's
disposition toward that activity
(i.e.,
attitude) as well as the fre-
quency of his or her participation
(i.e.,
behavior). Second, their
iden-
tification of four discrete levels of
loyalty provided important insights
into the complexity of the con-
struct. They demonstrated that the
traditional all-or-none portrayal of
loyalty as a simple dichotomy be-
tween loyal and nonloyal con-
sumers was far too narrow. For ex-
ample,
the ability to measure con-
sumers' strength of attachment to a
particular sport product or service
in order to separate the highly loyal
from the spuriously loyal is crucial
to distinguishing genuine loyalty
from habitual purchase behavior.
Commitment as
Attitudinal Loyalty
Although Backman and Crompton
(1991 a)
demonstrated the impor-
tance of linking attitudes with be-
haviors in measuring loyalty, the ap-
proach they used in
operationalizing the attitude com-
ponent, which they termed "psy-
chological attachment," was very
for measuring the attitude
bias component of loyalty.
These researchers devel-
oped a scale for measuring
loyalty toward specific
travel-service providers,
such as airlines and hotels.
They used the construct of
commitment as the founda-
tion for explaining the psy-
chological processes un-
derlying and leading to
consumer loyalty. A num-
ber of researchers have ar-
gued that psychological
commitment best describes
the attitude component of
loyalty. Day (1969) con-
tended true loyalty exists
only when there is "com-
mitment to a brand or
product." Jacoby and
Chestnut (1978) further
elaborated the construct's
connection to loyalty, stating that
"as a result of this evaluative
process, the individual develops a
degree of commitment to the brand
in question; he is 'loyal.' The con-
cept of commitment provides an es-
sential basis for distinguishing be-
tween brand loyalty and other forms
of repeat purchasing behavior
(p.
84).
According to Crosby and Taylor
(1984), people who are high in psy-
chological commitment "resist
changing their preference in re-
sponse to conflicting information or
experience" (p. 414). Drawing
heavily from the work of Crosby
and Taylor, Pritchard et al. (1999)
operationalized psychological com-
The purpose of this study is to extend Pritchard et al/s
(1999) work to estahlish a scale for assessing the strength
of an individual's commitment to sport teams. It is expected
that fans who demonstrate loyalty toward a sports team
possess an attitude bias that is both resistant to change
and persistent over time.
limited.
Pritchard, Havitz, and
Howard (1999) were the first to pro-
vide both a theoretically grounded
and psychometrically sound basis
mitment as the tendency to resist
changing one's preference based on
the desire to maintain cognitive
consistency. The desire for consis-
Volume 9 • Number
1
• 2000 • Sport Marketing Quarterly 17

tency between an individual's be-
liefs and feelings toward an object
produces a stable behavioral inten-
tion toward that object (Rosenberg,
1965). Support for Crosby and Tay-
lor's interpretation of commitment
based on resistance to change is
found in Kiesler's (1971) earlier
work on commitment. Kiesler and
associates established in several ex-
periments that the "effect of com-
mitment is to make an act less
changeable" (Kiesler & Mathog,
1971;
Kiesler & Sakamura, 1966,
p. 349). Moreover, recent research
suggests "that loyal consumers—
those who have a strong commit-
ment to a service or brand—show
strong resistance to counter persua-
sion attempts" (Schiffman & Kanuk,
1997,
p. 223).
Proceeding,
then,
on the belief
that psychological commitment was
a strong barometer of preference sta-
bility, Pritchard et
al.
(1999) devel-
oped a scale that measured the
atti-
tude component of loyalty on the
basis of how committed people were
toward a specific travel service. Fol-
lowing a rigorous scale construction
procedure (Churchill, 1979; Dawis,
1987), the researchers developed a
13-item scale that demonstrated
strong psychometric qualities. Using
samples across three travel-service
subsets (destination golf
resorts,
air-
lines,
hotels), Pritchard and his asso-
ciates produced an instrument dis-
playing consistently high reliability
as well as discriminant and conver-
gent validity.
Creating a Commitment
to Team Scale
The purpose of this study is to ex-
tend Pritchard et al.'s (1999) work
to establish a scale for assessing the
strength of an individual's commit-
ment to sport teams. It is expected
that fans who demonstrate loyalty
toward a sports team possess an at-
titude bias that is both resistant to
change and persistent over time. In
addition,
it is expected that strong
and weak attitudes, or levels of per-
sonal commitment, toward a team
would be effective guides to behav-
ior (Fazio, 1995; Petty, Haugtvedt, &
Smith,
1995). Those individuals
scoring high on the personal com-
mitment scale would accurately rep-
resent those fans truly devoted to a
particular
team.
Conversely, those
scoring low would be classified, at
best, as spuriously loyal, with a sub-
stantial number having little or no
emotional attachment to the team.
Determining the strength of an
indi-
vidual's attitude or commitment,
therefore, would allow for meaning-
ful differentiation between "fair-
weather" and "deeply committed"
fans (Smith
etal.,
1981).
Scale Development
The Psychological Commitment to
Team (PCT) scale (see Table 1) was
developed using multiple steps and
four phases of data collection. In-
strument development relied heav-
ily on the work of Pritchard et al.
(1999) and the suggestions of
Churchill (1979) on scale develop-
ment
(e.g.,
generating items, purify-
ing the measure, assessing reliabil-
ity and validity). Specifically, the
following steps were taken in the
current study: (a) items were gener-
ated;
(b) items were pretested;
(c) scale was tested with three sepa-
rate samples in three different team
sport settings
(i.e.,
professional foot-
ball,
college football, professional
basketball) to establish internal
consistency and reliability; and
(d) scale was tested with two sam-
ples (one from the University of Ok-
lahoma and one from The Ohio State
University) to determine if it had
construct and predictive validity.
Generating Items
Based on the findings of Crosby and
Taylor (1983) and the results of re-
cent attitude strength studies
(Haugtvedt & Petty, 1992;
Haugtvedt & Wegener, 1994), resis-
tance to change was believed to be
a critical factor underlying commit-
ment. Therefore, items were gener-
ated that emphasized the impor-
tance of resistance to change. In
particular, the authors attempted to
measure whether fans would re-
main committed to the team when
something occurred that might
change their commitment
(i.e.,
poor
team performance, loss of good
players, change in the coach).
A couple of items from the
origi-
nal Pritchard et al. (1999) PCI scale
were determined to be easily adapt-
able to a sports context and were
included in the item
pool.
As sug-
gested by Churchill (1979),
addi-
tional items based on a review of
the literature on sport fans were
then generated by the authors.
Churchill's suggestion that items be
worded both positively and nega-
tively was also followed. The Psy-
chological Commitment to Team
(PCT) scale used a
7-point
Likert
scale ranging from strongly
disagree
to strongly
agree.
Positively worded
items were scored from
1
for
strongly disagree to 7 for strongly
agree,
whereas negatively worded
items were scored from 7 for
strongly disagree to
1
for strongly
agree.
Therefore, a higher score al-
ways represented greater psycho-
logical commitment to the team.
The 15 total items generated were
then sent to a panel of judges to de-
termine the appropriateness of each
item with respect to clarity and face
validity. The panel, which included
experts in research related to sport
consumer behavior, provided unan-
imous support for the inclusion of
all 15 items.
Pretesting Items
A convenience sample (N=100) was
then used to examine the scale for
internal consistency. Using an initial
sample to purify the measure is also
a suggestion made by Churchill
(1979). All surveys collected were
usable. The respondents were in-
coming freshmen at The Ohio State
University who were recruited from
the 1994 summer orientation pro-
gram.
Each was asked to answer the
questions with regard to his or her
favorite National Football League
(NFL) team. Professional football
was selected because of its popular-
ity in the United States and because
of the general awareness of NFL
teams. A
USA Today/Gallup
Poll
found that professional football
18 Volume 9 • Number
1
• 2000 • Sport Marketing Quarterly

Table 1. Item-to-Total Correlations and Alpha Coefficients If That Item Were Deleted for the
PCT Scale
Item-to-Total Correlations
Alpha If Deleted
Item
Sample 2 Sample 3
(N=157)
Sample 4
(N=76)
Sample 2 Sample 3
Sample 4
1.
1
might rethink my allegiance to my favorite team if this team consistently performs poorly.
.595 .481 .739 .87 .88 .94
2.
I would watch a game featuring my favorite National Football League (NFL) team regardless of which team
they are playing.
.255 .353 .679 .88 .88 .94
3. I would rethink my allegiance to my favorite team if management traded away its best players.
.371 .473 .773 .88 .88 .94
4.
Being a fan of my favorite NFL team is important to me.
.635 .550 .760 .87 .87 .94
5. Nothing could change my allegiance to my favorite NFL team.
.673 .684 .723 .87 .87 .94
6. I am a committed fan of my favorite NFL team.
.733 .713 .808 .86 .86 .94
7. It would not affect my loyalty to my favorite NFL team if management hired a head coach that
1
disliked very
much.
.513 .497 .653 .88 .88 .94
8. I could easily be persuaded to change my favorite NFL team preference.
.690 .564 .791 .87 .87 .94
9. I have been a fan of my favorite team since I began watching professional football.
.360 .516 .569 .88 .88 .94
10.
1
could never switch my loyalty from my favorite NFL team even if my close friends were fans of another team.
.690 .728 .814 .87 .86 .94
11.
It would be unlikely for me to change my allegiance from my current favorite NFL team to another.
.765 .754 .781 .87 .86 .94
12.
It would be difficult to change my beliefs about my favorite NFL team.
.813 .760 .714 .86 .86 .94
13.
You can tell a lot about a person by their willingness to stick with a team that is not performing
well.
.354 .300 .465 .88 .88 .94
14.
My commitment to my favorite NFL team would decrease if they were performing poorly and there appeared
little chance their performance would change.
.426 .346 .739 .88 .88 .94
ranked first in popularity among the
four major professional sports in the
United States (as cited in Mihoces,
1995). Examination of the item-to-
total correlations found one item ("It
is normal for a person to change their
allegiance to a local team after relo-
cating") had a low negative correla-
tion with the total
(t^.O8).
Because
the item had such a low correlation
and did not ask about the fan's per-
sonal relationship with his or her fa-
vorite
team,
the item was eliminated
from the scale, resulting in the 14-
item PCT scale that was further tested
with the three remaining samples.
Establishing Internal
Consistency and Reliability
A second convenience sample
{N=^
51) was recruited from under-
graduate classes at the University of
Oklahoma. The original sample size
was 153, but 2 respondents were
eliminated because they indicated
they had no favorite team. The final
sample (N=151) included 89 men
(58.9%) and 62 women (41.1%)
with a mean age of 23.45 (approxi-
mately 23 years 6 months old). Re-
spondents were again asked to an-
swer the questions with regard to
their favorite NFL team. As per
Volume 9 • Number
1
• 2000 • Sport Marketing Quarterly 19

Churchill's (1979) recommendation,
Cronbach's (1951) coefficient alpha
was used initially to examine the
measure's internal consistency to
help establish reliability. Cronbach's
coefficient alpha estimate for the 14-
item PCT scale was .88. This
esti-
mate was greater than the .70
mini-
mum that has been suggested by
Nunnally and Bernstein (1994). Ex-
amination of the item-to-total corre-
lations (see Table 1) found that only
item number 2 had an item-to-total
correlation of less than .30 (r= .25).
This item was not eliminated from
the scale for several reasons:
(a) eliminating this item would not
have changed the coefficient alpha
estimate; (b) the item-to-total corre-
lation was very close to the .30
mark being used in this study; (c) the
item had an item-to-total correlation
well above .30 during the pretesting
of the scale (r = .54); and (d) the
item was believed to be important in
measuring psychological commit-
ment to team (PCT) because of the
results of prior research and the
studies related to the domain of this
item-to-total correlation for item 2
was .353. Therefore, the authors
believe the decision to keep this
item was appropriate.
The fourth convenience sample
(/V=76)
was collected from students
at The Ohio State University.
Self-
identified Ohio State fans were
asked to fill out the scale with re-
gard to the OSU football team. The
only item that had to be adjusted
group.
One common method for de-
termining the validity of
a
scale is to
distribute the scale to a group that
should score high on the scale
(Churchill,
1979). If the group does
in fact indicate a high score, this
would be further evidence to support
the scale's construct validity. When
examining the fourth convenience
sample, fans who indicated they had
a very strong interest in Ohio State
Overall,
the PCT scale demonstrated strong predictive
validity, and the analysis provided evidence of its construct
validity. Therefore, the scale appears to be useful with both
college and professional teams.
somewhat was item number 3. The
item,
which was worded
"1
would
rethink my allegiance to my favorite
team if management traded away its
best players" when examining pro-
fessional sport teams, was changed
to "I would rethink my allegiance to
the Ohio State football team if their
best players left the team
(i.e.,
trans-
football {N-43; a score of 6 or 7 on
a one-item measure with 1=Minimal
Interest to 7=Strong Interest), the PCT
score was very high (M=88.09,
S.D.=8.76). This is much higher than
the average score on the PCT scale
with the professional football sample
(A^=70.12) and the professional bas-
ketball sample (A^=62.60). In
addi-
The Psychological Commitment to Team (PCT) scale provides researchers with a reliable and
valid tool for measuring attitude loyalty, or the strength of fans' commitment to a particular
sports team. Previous research has shown that capturing the dispositional nature of attach-
ment is crucial to establishing true loyalty.
construct (Crosby & Taylor, 1983).
A third convenience sample
{M-^
57)
was recruited from a num-
ber of graduate and undergraduate
classes at the University of
Louisville. The sample included
113 men and 44 women with a
mean age of
23.01
years. This time
respondents were asked to answer
the questions with respect to their
favorite National Basketball
Association team. Cronbach's
coef-
ficient alpha was used once again
to examine the scale's internal con-
sistency. Cronbach's alpha estimate
for the 14-item scale was again .88,
establishing the reliability of the
scale items. The item-to-total corre-
lations (see Table 1) were .30 or
better for all items. In particular, the
fer, graduate, etc.)." All question-
naires were completed, and they
were all usable. Cronbach's coeffi-
cient alpha was used once again to
examine the scale's internal consis-
tency to help further establish relia-
bility. Cronbach's alpha estimate for
the 14-item scale was .94, again ex-
ceeding the minimum threshold of
.70 suggested by Nunnally and
Bernstein (1994). The item-to-total
correlations, shown in Table 1,
were better than .45 for all items.
Establishing Construct
and Predictive Validity
The authors used a number of meth-
ods to establish construct and pre-
dictive validity. First, the authors ex-
amined the PCT scale with a known
tion,
a one-way ANOVA (with inter-
est in OSU football as the
independent variable and score on
the PCT as the dependent variable)
showed that fans who indicated a
strong interest in OSU football (6 or
7) scored significantly higher on the
PCT scale than did fans who had less
interest in OSU football (N=33; less
than 6 on a scale of
1
to 7),
F(1,
74)
= 104.33, p <
.001.
Therefore, the
examination of the known group
provided support for the construct
validity of the PCT scale.
Second,
another method for de-
termining if an attitude scale is
valid is to examine if scores derived
from the scale can predict related
behaviors. In fact, a recent meta-
analysis by Kraus (1995) found that
20 Volume 9 • Number
1
• 2000 • Sport Marketing Quarterly

attitudes have been very useful in
predicting future behavior in a
vari-
ety of settings. Because a strong re-
lationship is expected between
atti-
tudinal loyalty and behavioral
loyalty, a series of analyses were
used to determine if the Psycholog-
ical Commitment to Team (PCT)
scale was significantly related to
various measures of behavioral loy-
alty. Using the second convenience
sample, the current study examined
the relationship between score on
the PCT scale and (a) the duration
of one's commitment to a team,
(b) the frequency with which, ac-
cording to their own report, the re-
spondents generally watched their
to Team scale again demonstrated
good predictive validity when used
to analyze Ohio State football fans
in the fourth convenience sample.
The relationship between score on
the PCT scale and three behavioral
measures of fan loyalty was exam-
ined.
First, a regression analysis was
used to determine whether the re-
spondents' scores on the PCT scale
could be used to predict the num-
ber of Ohio State football games at-
tended during the last season. The
results indicated that psychological
commitment to the Ohio State foot-
ball team did make a significant
contribution to the prediction of the
number of games attended.
p <
.001.
Analysis of the frequen-
cies indicated those who scored
higher on the PCT scale were more
likely to make every effort to watch
or listen to the team.
Overall,
the PCT scale demon-
strated strong predictive validity,
and the analysis provided evidence
of its construct validity. Therefore,
the scale appears to be useful with
both college and professional
teams.
Conclusion and Implications
The Psychological Commitment to
Team (PCT) scale provides re-
searchers with a reliable and valid
tool for measuring attitude loyalty.
Knowing what percentage of a team's existing fan base falls into
high,
spurious, latent, or low
loyalty categories provides a starting point for developing customized programs that account
for varying levels of attachment held by fans. The varying attitude-behavior combinations rep-
resented in each cell in Figure 1 suggest that different approaches to changing or maintaining
current levels of loyalty are required for each segment.
favorite team on television, and
(c) the percentage of games featur-
ing their favorite team that the re-
spondents actually watched during
the NFL regular season.
The correlations between the
Psychological Commitment to Team
(PCT) scale and all three behavioral
loyalty measures were examined to
determine whether the scale
demonstrated effective predictive
validity. High correlations with
these behavioral loyalty measures
would indicate that the measure is
appropriate for assessing attitudinal
loyalty. First, there was a significant
positive correlation between the
PCT scale and the number of years
as a fan of the favorite
team,
r= .426,
p <
.001.
Second, there was a sig-
nificant positive correlation be-
tween the PCT scale and how often
the respondents generally watched
their favorite team, r= .584,
p <
.001.
Third, there was a signifi-
cant positive correlation between
the PCT scale and the percentage of
the favorite-team games respon-
dents actually watched during the
NFL season, r = .563, p < .001.
The Psychological Commitment
(/?2 = .273, p< .001). Second, a
chi-square analysis examined
whether scores on the PCT scale (a
median split was used on PCT
score) could predict whether stu-
dents had purchased Ohio State
football tickets during the prior sea-
son.
The results of the chi-square
analysis indicated there was a sig-
nificant relationship between psy-
chological commitment to the OSU
football team and the purchase of
season tickets, x^ {df-^) - 8.85,
p < .003. Analysis of the frequen-
cies indicated that those who
scored higher on the PCT scale
were more likely to buy season tick-
ets.
Third, another chi-square analy-
sis examined whether "score" on
the PCT scale (a median split was
again used on PCT score) could
predict whether the student "makes
every effort to watch or listen" to
Ohio State football games he or she
does not attend. The results of the
chi-square analysis indicated there
was a significant relationship be-
tween psychological commitment
to the OSU football team and mak-
ing an effort to watch or listen to
the team, xMc//'=1) = 14.77,
or the strength of fans' commitment
to a particular sports team. Previous
research has shown that capturing
the dispositional nature of attach-
ment is crucial to establishing true
loyalty (Day, 1969; Dick & Basu,
1994). Research by Howard and
Thompson (1984) has shown that
customers' level of loyalty to a par-
ticular brand or service mediates
their responsiveness to accompany-
With spuriously loyal fans,
the strategy would be to
increase the psychological
commitment to the team
they are already supporting
behaviorally. Again,
increased attitudinal loyalty
among this segment is
extremely important because
these are generally the fans
who will stop supporting the
team when something goes
wrong
(e.g.,
team perfor-
mance decreases; a popular
player is traded).
Volume 9 • Number! • 2000 • Sport Marketing Quarterly 21

ing information and their intentions
to repurchase that good or service.
The stronger the attitude typically
the greater the likelihood of congru-
ent behavior. Not surprisingly,
then,
the more positively disposed
indi-
viduals are toward a particular ob-
ject, the more likely they are to at-
tend to advertising messages
relevant to that object, share
posi-
tive affirmations
(e.g.,
word of
mouth) about the object, and
ulti-
mately, purchase the product.
The initial tests conducted in this
study demonstrated the score de-
rived from the PCT scale by itself
can be very useful in predicting at-
tendance at sporting events and
television viewing behavior. The
scale's capabilities for predicting
loyal behavior in the future, how-
with behavior
(e.g.,
frequency of re-
peat purchase) provides a basis for
differentiating customers into mean-
ingful loyalty segments. The easy-
to-administer PCT scale provides
sport marketers with a tool for as-
sessing the extent to which their ex-
isting fan base falls into deeply
committed or fair-weather fan cate-
gories. Knowing what percentage of
a team's existing fan base falls into
high,
spurious, latent, or low loyalty
categories provides the basis for de-
veloping a marketing program that
optimizes the potential for strength-
ening fans' attachment to the team.
Knowing what percentage of a
team's existing fan base falls into
high,
spurious, latent, or low loyalty
categories provides a starting point
for developing customized pro-
Low-loyalty consumers are the most challenging segment.
These infrequent or nonattending patrons hold^ at best, an
ambivalent attitude toward the sports team. Converting this
segment's behavior and predisposition is likely to he very
expensive, and even then, the probability of success is low.
ever, are more fully realized when
the PCT score is combined with a
measure of past behavior. As Back-
man and Crompton
(1991 a,
b) and
Pritchard et al. (1999) demon-
strated,
combining attitude loyalty
grams that account for varying lev-
els of attachment held by fans. The
varying attitude-behavior combina-
tions represented in each cell in
Figure
1
suggest that different ap-
proaches to changing or maintain-
ing current levels of loyalty are re-
quired for each segment (see Table
2).
The following sections discuss
specific marketing strategies and
tactics for optimizing the strength of
fans'
attachment to a team for each
of the four loyalty segments.
High-Loyalty Segment
Description
In the upper left quadrant of Figure
1 are the truly loyal fans
(i.e.,
high
loyalty). Fans in this segment score
high on the PCT scale
(i.e.,
high at-
titudinal loyalty) and exhibit strong
behavioral loyalty
(e.g.,
attending
games, watching games on televi-
sion).
For these fans, the relation-
ship with the team has probably be-
come a significant part of their
lives,
and they are unlikely to
change their behavior or level of
commitment. However, the loyalty
level of this group may decrease
slowly over time if this segment is
ignored by marketers or may de-
crease more quickly if something
very drastic happens.
Strategy
A reinforcement strategy is the best
means for marketing to the highly
loyal fans (Pritchard et
al.,
1999;
Sheth,
1987). This strategy should
focus on reinforcing existing cogni-
Table
2.
Suggestions
for
Marketing
to the
Four Loyalty Segments
Segment Suggestions
High Loyalty
Spurious Loyalty
Latent Loyalty
Low Loyalty
Marketers should use a reinforcement strategy that includes reinforcing behavioral loyalty
through economic incentives and attitudinal loyalty through personalized encouragement. This
strategy is designed to increase the yield from this segment and to avoid any chances of losing
the segment.
Marketers should focus on increasing the fans' psychological commitment through the use of a
rationalization strategy. This can be done by promoting the positive attributes of the product or
service, getting the fans to articulate why they support the team, and/or coupling attendance
with support of
a
relevant social cause.
Marketers should focus on increasing the positive behaviors of the latently loyal fan by using a
market inducement strategy. This can be done by removing significant barriers to behavior and
by offering economic incentives to engage in certain behaviors.
Although some might suggest marketers use a confrontation strategy, which requires a direct at-
tack on the fan's existing attitudes, others believe this may only lead to strengthening the fan's
low level of commitment. Many strategists instead recommend focusing on using either a ratio-
nalization strategy to increase commitment or an inducement strategy to increase behavior as a
first step to high loyalty.
22 Volume 9 • Number
1
• 2000 • Sport Marketing Quarterly

tions,
allaying the potential for disso-
nance to occur (Pritchard et al.,
1999;
Sheth, 1987). Because they
are so valuable to the
team,
mar-
keters want to avoid a situation in
which highly loyal fans would de-
crease their behavior or reconsider
their allegiance to their favorite
team.
Moreover, marketers want to
focus on increasing the behavior of
these loyal fans
(e.g.,
number of
games attended, amount of mer-
chandise purchased) and increasing
the strength of their commitment.
Therefore, the reinforcement strategy
involves a two-pronged approach.
First, behavioral loyalty can be
rein-
forced extrinsically through eco-
nomic incentives
(e.g.,
discounts,
value-added services). Second, psy-
chological reinforcement based on
intrinsic rewards can be provided by
personalized encouragement
(e.g.,
newsletters, VIP treatment). The ob-
jective is to progressively increase
the yield from these best consumers
by developing a long-term, interac-
tive,
value-added relationship.
For example, the San Diego
Padres have developed a successful
program for rewarding their most
loyal customers
("With
Frequency,"
1996). Recently, this Major League
Baseball team developed a loyalty
program designed to reward frequent
attendance, as well as to encourage
fans to attend as many games as pos-
sible.
The Padres reward fans by al-
lowing those who attend games to
register for membership in the Com-
padres Club. Based on frequency of
game attendance, club members
earn points
("hits")
toward increas-
ingly attractive prizes, including ex-
clusive autograph sessions and in-
clusion in pregame chalk talks.
Registration for club membership
also allows the Padres to identify
their most loyal customers, to send
customized newsletters, and to so-
licit consumer satisfaction feedback
from these most desirable fans.
Spurious-Loyalty Segment
Description
Spuriously loyal fans, those in the
upper right quadrant of Figure 1,
are fans who exhibit high levels of
behavioral loyalty, but score low on
the PCT scale. These fans may ap-
pear to most observers to be loyal
fans of the team because they be-
have in the same manner as the
truly loyal fans
(e.g.,
frequently at-
tending games, frequently watching
games on television). However, they
are not committed fans of the fa-
vorite team and could drop out at
any point with little dissonance.
There may be a number of reasons
for this high level of behavior ac-
companied by low commitment,
such as (a) they attend ganies pri-
marily because friends or family
want to attend; (b) they attend
games of the home team, but are
fans of
a
team in another location;
(c) games are a relatively cheap
source of entertainment; (d) they are
given the tickets for free (by an em-
ployer or another business); or
(e) they go to the game for other
reasons
(e.g.,
business interactions,
socializing, drinking, gambling).
Strategy
With spuriously loyal fans, the strat-
egy would be to increase the psy-
chological commitment to the team
they are already supporting behav-
iorally. Again, increased attitudinal
loyalty among this segment is ex-
tremely important because these are
generally the fans who will stop
supporting the team when some-
thing goes wrong
(e.g.,
team perfor-
mance decreases; a popular player
is traded). Sheth (1987) recom-
mends a market rationalization
strategy as a way to strengthen con-
sumers' commitment toward a
prod-
uct they are already buying. The in-
tent is to create rationalized reasons
to justify their behavior.
One approach is to focus on pro-
moting the attributes of the product
or service (Sheth, 1987) in an at-
tempt to provide the spuriously loyal
fan with rational reasons why he or
she should support the team
(e.g.,
first-class tradition, fan-friendly
team). Second, it would also be
helpful to get the fans "to articulate,
at least on a rationalized basis, why
they buy or use the product/service"
(Sheth,
1987, p. 27). Prior research
suggests that as consumers try to jus-
tify their purchase, they tend to be-
come more committed to the
prod-
uct or service they purchased
(Schiffman & Kanuk, 1997).
Third,
coupling attendance with
support for a relevant social cause
may be an important rationalized
reason for some spuriously loyal
fans.
An emerging strategy, called
alignment marketing, attempts to
improve a brand or company's for-
tunes by linking it to some highly
valued celebrity or cause (lEC,
1995). Alignment marketing is based
on the belief that if an organization
is able to build a link in the con-
sumer's mind between the product
name and a cause that is of great
importance to that consumer
(e.g.,
feeding and sheltering the homeless,
civic pride), then there is a strong
probability that the consumer's per-
ception of that particular brand or
product will improve. This strategy
may also provide the basis for fans
to rationalize
and,
therefore,
strengthen their emotional commit-
ment to a team. A
team,
for exam-
ple,
that demonstrates its commit-
ment to helping battered women by
pledging a portion of each ticket
sold to fund or construct a new
shel-
ter provides the spuriously loyal fan
one more important reason to care
about the organization and to attend
games. In a college sport setting, it
may be possible to focus on the
team's high graduation rate, suggest-
ing this is a program that values ed-
ucation first, or focus on the number
of local players on the team, playing
on the belief of some that it is im-
portant to support local "kids."
Latent-Loyalty Segment
Description
In contrast to spuriously loyal fans,
latently loyal fans (lower left quad-
rant of Figure 1) are those who
scored high on the PCT scale, but
exhibit low levels of behavioral loy-
alty. Although these fans are un-
likely to change their team alle-
giance, they do not exhibit many of
the behaviors that would benefit the
team
(e.g.,
attending games). There
may be a number of reasons for
Volume 9 • Number
1
• 2000 • Sport Marketing Quarterly 23

their low level of behavior includ-
ing the high cost of some games,
the time it takes to attend a game,
and the accessibility of games.
Many people in this segment may
constitute what Muliin et al. (1993)
refer to as "media consumers,"
those whose commitment is high
but whose behaviors related to their
favorite team are limited to more
passive, indirect involvement
through watching or listening to
games and reading about the team
in the newspaper. Moreover, fans
who live outside their favorite
team's region may have difficulty
obtaining even media access to
games and would, therefore, exhibit
even less loyalty-related behavior.
Strategy
According to Sheth (1987), the mar-
ket inducement strategy is most use-
ful in reaching latently loyal con-
sumers. To induce these fans to
move toward more active, direct
participation and into the
"high-
loyalty" group, where their behav-
ior matches their attitude, Sheth
recommends two approaches. First,
the facilitation of inducement in-
volves eliminating any obstacles
that prevent consumers from pur-
chasing the product or service they
like.
"It involves removal of time,
place and possession barriers in tar-
get segments" (Sheth, p. 26). Sec-
ond,
economic incentives are an-
other way to induce people to
engage in behavior toward which
they have a positive predisposition.
Incentives could include a range of
sales and promotional programs,
such as coupons, ticket-price dis-
counts, and the offering of lottery
prizes.
The Milwaukee Brewers initiated
a ticket-package campaign intended
to reach fans who had not histori-
cally purchased season ticket pack-
ages (Eisengerg, 1993). Rather than
just offering traditional
full-
(81
games) or halfseason (40 games)
ticket options, the Major League
Baseball club created a series of
miniticket packages (13 games) tai-
lored to the specific interests and
abilities of their fan base (Eisen-
gerg).
In effect, fans were offered
the opportunity to attend Brewer
games on the dates
(e.g.,
weekdays,
Saturdays, and/or Sundays only)
they most preferred and at the time
they most preferred (afternoon or
evenings) and to watch the combi-
nation of teams they most preferred,
all at a substantial discount. The
new program was enormously suc-
cessful,
increasing new or first-time
season ticket sales by
41%
(Eisen-
gerg).
Meanwhile, teams may also
want to focus on increasing the
media coverage of their games in
order to reach fans who are not
geographically close to their fa-
vorite team. For example, many
college sport teams are focusing on
increasing the radio reach of their
games
(e.g.,
picking stations with a
wider reach, offering games over
the internet) and on increasing ac-
cess to televised games
(e.g.,
pay-
per-view) in order to reach their
fans and alumni who do not live in
their geographic region.
Low-Loyalty Segment
Description
Finally, low-loyalty fans (lower right
quadrant of Figure 1) are those who
scored low on the PCT scale and ex-
hibited low levels of behavioral loy-
alty. These fans are not committed
to the team and rarely support the
team by attending games or by
watching on television. It is likely
that when these fans do attend
games, it is merely for some reason
unrelated to the team itself
(e.g.,
to
watch a particular player, to watch
the opposing
team,
to socialize).
They could drop out, and this would
have no psychological impact on
them and would result in almost no
change in their daily lives.
Strategy
Low-loyalty consumers are the
most challenging segment. These
infrequent or nonattending patrons
hold,
at best, an ambivalent
atti-
tude toward the sports team. Con-
verting this segment's behavior and
predisposition is likely to be very
expensive, and even
then,
the
probability of success is low. Sheth
(1987) recommended a confronta-
tion strategy for reaching this disen-
franchised market. This approach
requires a direct attack on existing
attitudes of the consumer. How-
ever, achieving the desired change
may be very difficult. As Kiesler
(1971) points out, this approach
often results in a "boomerang ef-
fect" in which counterpersuasive
communication strengthens the re-
cipient's resistance to change.
Moreover, the confrontation
process is not a cost-efficient ap-
proach in terms of actually turning
consumer attitudes and behavior.
A second approach would be to
allow the movement of fans toward
genuine loyalty to be undertaken
gradually, concentrating on either
behavioral or attitudinal change first
(i.e.,
movement to spuriously or la-
tently loyal). Marketers could focus
on increasing the behavior first. This
could be done by offering packages
to various groups
(e.g.,
families,
businesses) that may result in the
low-loyalty fans attending more
games, by selling the game to the
low-loyalty fans as part of an entire
entertainment package, or by focus-
ing on attributes other than the team
(e.g.,
opposing
team,
star player). In
addition,
the rationalization strategy
could be used to first focus on build-
ing a level of commitment to the
team.
However, both of these ap-
proaches are unlikely to produce
highly successful results with this
segment and may not be the best
use of resources. Consequently,
many strategists recommend focus-
ing on the more attractive, less resis-
tant spuriously loyal and latently
loyal fans (Hawkins, Best, & Coney,
1995;
Rothschild, 1987).
Summary
In general, the PCT scale can be
very helpful to sport marketing
practitioners who wish to use psy-
chographic information to better
target their fans and to better assess
the current feelings about the team
among fans and/or local residents.
The scale is relatively short (it could
even be used as part of
a
phone sur-
vey),
easy to administer, and easy to
24 Volume 9 • Number
1
• 2000 • Sport Marketing Quarterly

adjust to different team sports at dif-
ferent competition levels. Use of the
scale will allovk' marketers to better
assess loyalty toward their team and
to be better prepared for their fu-
ture.
The scale can also be useful in
assessing the impact of past and
current marketing and customer ser-
vice efforts. Sport marketers who
wish to move beyond the "build it
and they will come" philosophy of
sport marketing should find this
scale useful in moving their market-
ing efforts forward.
References
Baade, R. A., & Tiehan, L.
J.
(1990). An
analysis of major league baseball atten-
dance:
1969-1987. Journal of
Sport
and
So-
cial
issues,
14, 14-32.
Backman,
S.
J.,
& Crompton,
J.
L. (1991a).
The usefulness of selected variables for pre-
dicting activity loyalty.
Leisure
Sciences,
13,
205-220.
Backman,
S.
J.,
& Crompton,
J.
L.
(1991
b).
Using a loyalty matrix to differentiate be-
tween
high,
spurious, latent and low loyalty
participants in tow leisure services. Journal
of
Park
and
Recreation
Administration, 9,
117.
Bureau of Economic Analysis (1996, Janu-
ary/February).
Survey
of current
business,
6.
Washington, DC: U.S. Department of Com-
merce.
Churchill,
C. A., )r. (1979). A paradigm for
developing better measures of marketing
constructs. Journal of Marketing
Research,
16,64-73.
Cronbach,
L.
J.
(1951). Coefficient alpha
and the internal structure of
tests.
Psychome-
trika,
76,297-334.
Crosby, L. A., & Taylor,
J.
R. (1983). Psy-
chological commitment and its effect on
postdecision evaluation and preference sta-
bility among voters. Journal of
Consumer
Re-
search,
9,
413-431.
Dawis, R. V. (1987). Scale construction.
Journal of
Counseling
Psychology,
34,
481-489.
Day, C. S. (1969). A two dimensional con-
cept of brand loyalty. Journal of Advertising
Research,
9, 29-35.
Dick, A. S., & Basu, K. (1994). Customer
loyalty: Toward an integrated conceptual
framework. Journal of
the
Academy of Mar-
keting
Science,
22, 99-113.
Eisengerg,
J.
(1993, October). Small-market
success: How the Milwaukee Brewers sold
43%
more season tickets.
Team
Marketing
Report,
pp. 9-11.
Eisler, P. (1997, March 27). Guys go awry
over losing. USA
Today,
p. 1D.
Evans,
J.
R., & Berman, B. (1994). Market-
mg(6th ed.). New York: Macmillan.
Fazio,
R. H. (1995). Attitudes as object-
evaluation associations: Determinants, con-
sequences, and correlates of attitude accessi-
bility. In R. E. Petty &
J.
A. Krosnick (Eds.),
Attitude
strength:
Antecedents
and
conse-
quences
{pp.
247-282). Mahwah, NJ:
Lawrence Eribaum Associates.
Guttmann,
A. (1986).
Sports
spectators.
New York: Columbia University.
Haugtvedt, C.
P.,
& Petty, R. E. (1992). Per-
sonality and persuasion: Need for cognition
moderates the persistence and resistance of
attitude changes. Journal of
Personality
and
Social
Psychology,
63, 308-319.
Haugtvedt, C. P, & Wegener, D. T. (1994).
Message order effects in persuasion: An
atti-
tude strength perspective. Journal of
Con-
sumer
Research,
21, 205-218.
Havitz, M., & Howard, D. R. (1995). How
enduring is enduring involvement? A seasonal
examination of three sports activities.
Journal
of
Consumer
Psychology,
4, 255-276.
Hawkins, D. I., Best, R.
J.,
& Coney, K. A.
(1995).
Consumer
behavior:
Building mar-
keting
strategy
(7th ed.). New York: McGraw-
Hill.
Howard,
D. R., & Crompton,
J.
L. (1995).
Financing
sport.
Morgantown, WV: Fitness
Information Technology, Inc.
Howard,
D. R., & Thompson, P. (1984).
The critical importance of the distribution
variable in marketing strategy.
Visions
in
Leisure
and
Business,
3{2), 34-40.
International Events Group (1995). lEC's
complete guide to
sponsorship.
Chicago, IL.
Jacoby,
J.,
& Chestnut, R. W. (1978). Brand
loyalty:
Measurement
and
management.
New York: Wiley.
Jacoby,
J.,
& Kyner, D. B. (1973). Brand
loyalty V. repeat purchase behavior. Journal
of Marketing
Research,
10, 19.
Kiesler, C. A. (1971).
The
psychology of
commitment. New York: Academic Press,
Inc.
Kiesler, C. A., & Mathog,
J.
(1971). Resis-
tance to influence as a function of number of
prior consonant acts: A test. In C. A. Kiesler
(Ed.),
The
psychology of
commitment.
New
York: Academic Press, Inc.
Kiesler, C. A., & Sakamura,
J.
(1966). A test
of a model for commitment. Journal of
Per-
sonality and Social
Psychology,
3, 349-353.
Kraus,
S.
J.
(1995). Attitudes and the pre-
diction of behavior: A metaanalysis of the
empirical literature.
Personality
and
Social
Psychology
Bulletin, 21, 58-75.
Lee,
H. M. (1983). The sport fan and team
loyalty in ancient Rome.
ARETE:
The Journal
of Sport
Literature,
1, 139-145.
Mihoces, G. (1995, May 23). Fans fight
poststrike hangover. USA
Today,
pp. C1-C2.
Mullin,
B.
J.,
Hardy, S., & Sutton, W. A.
(1993).
Sport
marketing.
Champaign, IL:
Human Kinetics Publishers.
Murrell,
A.
J.,
& Dietz, B. (1992). Fan sup-
port of sports teams: The effect of
a
common
group identity. Journal of
Sport
and
Exercise
Psychology,
/
4,
28-39.
National Sporting Goods Association.
(1996).
The sporting goods
market in 1995.
ML.
Prospect, IL: National Sporting Goods
Association.
Nunnally,
J.
C, & Bernstein, I. H. (1994).
Psychometric
theory
{3rd
ed.). New York:
McGraw-Hill.
Olson,
J.
C, & Jacoby,
J.
(1971). A con-
struct validation study of brand loyalty. Pro-
ceedings
of
the
American
Psychological
As-
sociation, 6, 657-658.
Petty, R. E., Haugtvedt, C.
P.,
& Smith,
S. M. (1995). Elaboration as a determinant of
attitude strength: Creating attitudes that are
persistent, resistant, and predictive of behav-
ior. In R. E. Petty &
J.
A. Krosnick (Eds.),
Atti-
tude
strength:
Antecedents
and
conse-
quences
{pp.
93-130). Mahwah, NJ:
Lawrence Eribaum Associates.
Pritchard,
M. P, Havtiz, M. E., & Howard,
D. R. (1999). Analyzing the commitment-loy-
alty link in service contexts.
Journal
of
the
Academy of Marketing
Science,
27, 333-348.
Rosenberg, M.
J.
(1965). When dissonance
fails:
On eliminating evaluation apprehen-
sion from attitude measurement. Journal of
Personality
and Social
Psychology,
1,
28-43.
Rothschild,
M. L. (1987). Marketing com-
munications:
From fundamentals
to
strategies.
Lexington,
MA: D. C. Heath & Company.
Schiffman,
L. G., & Kanuk, L. L. (1997).
Consumer
behavior
{6th
ed.). Upper Saddle
Run,
NJ: Prentice-Hall.
Sheth,
J.
N. (1987). A normative theory of
marketing practice. In G. Frazier & N. Sheth
(Eds.),
Contemporary views of
marketing
practice
{pp.
19-31). Lexington, MA: Lexing-
ton Press.
Sloan,
L. R. (1989). The motives of sports
fans.
In
J.
H. Goldstein (Ed.),
Sports,
games,
and
play:
Sociological and psychological
viewpoints {2nd ed.; pp. 175-240). Hills-
dale,
NJ: Lawrence Eribaum Associates.
Smith,
G.
J.,
Patterson, B., Williams, T.,
& Hogg,
J.
(1981,
September). A profile of
the deeply committed male sports fan. Arena
Review,
5, 26-44.
U.S. Bureau of
Census.
(1993). Statistical
abstract
of
the
United
States:
7 993
(113th
ed.).
Washington, DC: U.S. Department of
Commerce.
Wakefield,
K. L., & Sloan, H.
J.
(1995). The
effects of team loyalty and selected stadium
factors on spectator attendance. Journal of
Sport
Management,
9, 153-172.
With frequency promotion and database
marketing.
Padres expect fans to have many
happy returns. (1996, March).
Team
Market-
ing
Report,
pp. 3, 8.
Zillman,
D., & Paulus, P. B. (1993). Specta-
tors:
Reaction to sporting events and effect
on athletic performance. In R. N. Singer, M.
Murphey, & L. K. Tenant (Eds.), Handbook of
research
on
sport
psychology
{pp.
600-619).
New York: Macmillan.
Volume 9 • Number
1
• 2000 • Sport Marketing Quarterly 25

