
Have We Got the Bottle?
Implementing a Deposit Refund
Scheme in the UK
A report for the Campaign to Protect Rural England
Authors:
Dominic Hogg
Debbie Fletcher
Tim Elliott
Maxine von Eye
September 2010

Eunomia Research and Consultancy
Eunomia is an environmental consultancy that supports positive change. Our clients, from
both government and the private sector, turn to us for policy development and analysis,
service design and review, technology and market assessment, regulatory compliance and
project management.
Policy Development
Our commitment to environmental issues dates back to well before these concerns were
prominent in the national political debate. Now as then, Eunomia seeks to lead the way in
policy formulation and implementation. We are able to marry perspectives from science,
economics, politics and social science to bring forward practical proposals with the
potential to deliver cost-effective benefits. We are recognised as leaders not only in
understanding the direction of waste and energy policy, but in determining its trajectory
through commissions for Defra, Department of Energy and Climate Change, Renewable
Fuels Agency and the Committee on Climate Change.
Local Government
Our technical skills, commercial experience and local government know-how mean our
clients turn to us when they want to achieve high recycling rates and high levels of resident
satisfaction as cost effectively as possible. In recent years we have worked with over 100
local authorities, supporting them with contract procurements, partnership development,
service efficiency reviews and service design.
Private
We act on behalf of a range of organisations operating in the waste and energy sectors,
including financial institutions, utilities, property companies and technology providers.
Eunomia is recognised as a leader in understanding the direction and trajectory of
environmental policy. We are therefore able to provide key insight to ensure that our clients
are one step ahead and can make key commercial decisions quickly and effectively.
Eunomia Research and Consulting Ltd
62 Queen Square
Bristol
BS1 4JZ
United Kingdom
Tel: +44 (0)117 945 0100
Fax: +44 (0)8717 142 942
www.eunomia.co.uk

ii
Campaign to Protect Rural England
The Campaign to Protect Rural England (CPRE) is a charity that campaigns for a sustainable
future for the English countryside, a vital but undervalued environmental, economic and
social asset to the nation.
We want a beautiful, tranquil and diverse countryside that everyone can value and enjoy. We
promote positive solutions for the long-term future of the countryside, ones which respect
the character of England’s natural and built landscapes.
We aim to:
• Influence land use in town and country for people and nature.
• Protect and enchance beauty, tranquillity and local distinctiveness.
• Increase and harness public and political support for the countryside.
CPRE’s Stop the Drop campaign is working to stop the blight of litter and fly-tipping on our
countryside, cities, waterways, towns and villages.
Campaign to Protect Rural England
128 Southwark Street
London
SE1 0SW
Tel: +44 (0)20 7981 2800
Fax: +44 (0)20 7981 2899
www.cpre.org.uk
Registered charity number: 1089685
CPRE is a company limited by guarantee, registered in England, number 4302973
© Campaign to Protect Rural England 2010
Disclaimer
Eunomia Research & Consulting has taken due care in the preparation of this report to ensure that
all facts and analysis presented are as accurate as possible within the scope of the project. However
no guarantee is provided in respect of the information presented, and Eunomia Research &
Consulting is not responsible for decisions or actions taken on the basis of the content of this report.
Acknowledgements
Our thanks to Canadean Ltd, TOMRA Systems ASA, Reverse Vending Corporation, Anker Andersen
A/S, Frank LeBlanc at the Department for the Environment in New Brunswick, REPANT ASA, Pasi
Nurminen at Palpa and Bryan Howell (HBH Business Solutions Inc.) for their inputs into the
discussion on costs associated with setting up a deposit refund system and for the provision of data
where requested.
3
Contents
1.0 Introduction and Background ...................................................................................5
1.1 What are Deposit Refund Schemes ...................................................................... 7
2.0 Deposit Refund Schemes in the UK .........................................................................7
2.1 Scotland ...................................................................................................................14
2.2 Summary View ........................................................................................................15
3.0 Economic Rationale for Deposit Refund Schemes............................................. 15
3.1 Summary View ........................................................................................................17
4.0 Possible Benefits of Deposit Refund Schemes ................................................... 18
4.1 Increasing Recycling ..............................................................................................18
4.2 Effects on Littering .................................................................................................24
4.3 Implications for Transport .....................................................................................31
4.4 Summary View ........................................................................................................32
5.0 Methodology for Cost Benefit Analysis ................................................................. 33
5.1 Summary of Existing Deposit Systems Worldwide ...........................................34
5.2 Mass Flows – Baseline and Scenarios ................................................................35
5.3 UK Deposit Refund System Model.......................................................................38
5.4 Cost Reduction in Existing Waste Collection Systems......................................46
5.5 Environmental Impacts..........................................................................................50
5.6 Cost Benefit Analysis..............................................................................................52
6.0 Results from Cost Benefit Analysis....................................................................... 54
6.1 Complementary System ........................................................................................54
6.2 Parallel System .......................................................................................................65
6.3 Sensitivities..............................................................................................................68
6.4 One-Off Costs...........................................................................................................78
6.5 Single Market Considerations...............................................................................79
6.6 Cross Border Issues – Private Trade in Alcohol bringing Non-Deposit
Containers into the UK .....................................................................................................82
7.0 Summary and Conclusions..................................................................................... 84
A.1.0 Review of Deposit Refund Systems................................................................... 92
A.2.0 Cost Benefit Analysis Model .............................................................................100
A.2.1 Materials to be Included in Deposit Refund System ..................................... 102
A.2.2 Baseline...............................................................................................................103
4
A.2.3 Scenarios.............................................................................................................113
A.3.0 The Deposit Refund System Model..................................................................119
A.3.1 The Deposit and Return Rates .........................................................................123
A.3.2 Handling, Collection, Logistics, and Processing............................................. 125
A.3.3 On-Going Costs for Central System..................................................................147
A.3.4 Material Revenues .............................................................................................149
A.3.5 Administration Fee.............................................................................................149
A.3.6 Set-Up Costs........................................................................................................150
A.4.0 Additional Cost Modelling .................................................................................154
A.5.0 Environmental Impacts .....................................................................................158

5
1.0 Introduction and Background
Eunomia Research & Consulting is pleased to present this report to the Campaign to
Protect Rural England (CPRE). The report investigates the environmental and
financial implications of the introduction of a UK-wide deposit refund system (DRS).
In April 2008, CPRE launched its Stop the Drop campaign against litter and fly-
tipping, with the twin aims of getting existing litter picked up and preventing further
litter being dropped. As part of the campaign it worked with Policy Exchange in 2009
to publish Litterbugs: How to deal with the problem of littering
1
, which detailed a
suite of proposals for addressing litter.
One of the key recommendations of that report was for the introduction of a
national deposit scheme, linked into broader waste and recycling policies, in light of
the research findings that deposit refund schemes (DRSs) significantly reduce litter
and help to promote virtuous cycles of behaviour.
Discussion regarding DRSs is often polarised between the views of ardent
supporters, and those of equally vehement opponents. The available theoretical
literature, however, suggests that such schemes are an efficient means of
increasing recycling rates and reducing litter, though a key issue in moving from
theory to practice is determining the costs of administering and implementing the
scheme.
A review of secondary literature, however, does not shed much further light on the
matter. In one such review, we recently concluded:
2
Views appear to be polarised regarding the costs of introducing such a
scheme, and few studies from the available literature would appear to enable
one to confidently assert that the approach incurs costs well above the
additional benefits which might be derived. There are, however, indications
that such schemes would need to be designed with great care to ensure costs
were aligned with the hoped-for benefits.
There is, therefore, a pressing need to understand what might be the costs and
benefits of introducing such a scheme, recognising that it would provide an efficient
means to increase recycling and reduce littering.
The aim of this report, therefore, is to investigate the costs and benefits of a UK-wide
DRS and advance the debate on the benefits and disadvantages of DRSs.
3
Through
bottom-up modelling, we sought to answer the following question:
1
Policy Exchange and CPRE (2009) Litterbugs: How to deal with the problem of littering, London:
Policy Exchange, 2009.
2
Eunomia et al. (2009) International Review of Waste Management Policy: Annexes to Main Report,
Report for Department of the Environment, Heritage and Local Government, Ireland, September
2009.

6
‘How do the benefits of introducing a UK-wide DRS for certain beverage
container packaging compare with the costs of implementation and
operation?’
The report is particularly timely given the devolved administrations active
commitment to achieving zero waste economies and the publication in May 2010 of
the Coalition’s Programme for Government, which states that:
“We will work towards a ‘zero waste’ economy, encourage councils to pay
people to recycle, and work to reduce littering”.
4
This report details how DRSs can offer the opportunity to reduce littering, to increase
recycling and consequently to increase the amount of waste that is diverted from
landfill and other residual waste treatment options. Individuals are able to return
their empty containers whilst ‘on the go’ and to subsequently recoup their deposit,
with the system thus encouraging them to deal with their waste in a responsible
manner. Hence the twin objectives of reducing littering and increasing recycling can
be met.
Significantly, this study uses logistics modelling to understand how the costs of
household waste collections change when the DRS is put in place. To our
knowledge, no study has carried out this work in a satisfactory manner. It is,
however, crucial for understanding the true costs (net of savings) of introducing a
DRS.
5
Furthermore, most existing studies only assume one scenario, where the existing
kerbside collection systems remain in place. This study examines the costs and
benefits associated with introducing a DRS in the UK under two scenarios. First, it
models a complementary system, which means beverage containers are no longer
collected at the kerbside. Second, it looks at a parallel system, where the household
kerbside systems for beverage containers target the same range of materials that
are covered by the DRS.
In addition, the report looks in considerable detail at the potential environmental
benefits associated with the increase in material collection, above existing systems,
as well as the potential savings derived from removing deposit-bearing litter from
the environment. It also seeks to understand the associated negative effects – the
disamenity - of litter, though the literature here is somewhat lacking and highlights a
clear need for further research.
3
We note that this research was undertaken by the consultants on the understanding that the results
may not be favourable. The aim was always to be as objective as possible, despite the orientation of
CPRE. CPRE was also aware that the results might not support its views.
4
HM Government (2010) The Coalition: Our Programme for Government, available at
http://www.cabinetoffice.gov.uk/media/409088/pfg_coalition.pdf
5
The closest any study comes to doing this adequately is a study by BDA Group in Australia. The
study most often cited by opponents of deposit schemes is one by BIO Intelligence Service, which
includes no serious attempt to model the change in the cost of the kerbside collection logistics.

7
1.1 What are Deposit Refund Schemes
DRSs have been defined as follows:
“A deposit-refund system is the surcharge on the price of potentially polluting
products. When pollution is avoided by returning the products or their
residuals, a refund of the surcharge is granted.” OECD, Glossary of Statistical
Terms.
6
A DRS encourages the return of the materials into an organised reuse, recycling or
treatment / disposal process. The producers typically finance the process through
the payment of an administration fee on each container. Drinks containers are the
most common target of DRSs, though economic theory suggests the schemes could
be applicable to hazardous materials and other waste streams, subject to
transaction costs being minimised. The systems can encourage recycling and / or
reuse where otherwise it is easy to dispose of containers with the residual waste or
for them to be discarded as litter. The same policy mechanism can also be used to
target difficult to dispose of, or hazardous, items to ensure that these do not reach
the residual waste stream. This can be considered a waste prevention policy as it
reduces the hazardousness of materials in the waste stream.
Non-drinks container examples include:
¾ Batteries (Swedish Östhammar example) and car batteries (Germany);
7
and
¾ Tyres (Maine, USA).
Finally, some countries, such as Sweden, make use of vehicle scrapping charges,
which discourages the dumping of vehicle bodies in rural areas and ensures that
cars are returned to registered scrapping destinations at the end of their life.
8
Appendix A.1.0 details a number of countries and states which have made use of
deposit schemes.
2.0 Deposit Refund Schemes in the UK
Some readers will be old enough to remember that in the 1970’s, in the UK, one
often paid a deposit on bottles of fizzy drinks and beer. When the drink was finished,
one would return empty bottles to the store, or even have them collected from the
front door as part of the milkman service, in order to retrieve the deposit. The
system led to high return rates for glass bottles, which were typically washed for
refilling. The bottles were designed for re-use many times over.
Since the broad demise of these schemes in the UK (though they are still applied in
some notable cases, for example the A. G. Barr scheme in Scotland), there have
been various studies which have looked at the use of deposit refunds here.
6
http://stats.oecd.org/glossary/detail.asp?ID=594
7
http://www.eeb.org/activities/waste/EEB-mini-brief-deposit-schemes-for-Batteries-March2004.pdf
8
The (sometimes temporary) scrapping charges which have become popular across nations in the
context of the current economic decline have their precedent in the more permanent schemes which
some countries employ to ensure that end-of-life vehicles are returned to an appropriate recycler.

8
This Chapter critically reviews the way in which previous Governments have
appraised the potential for using DRSs in the UK. It highlights the fact that particular
views have been formed, even in the absence of the evidence which would be
required to enable one to develop such views on an objective basis.
One of the initial review studies was undertaken by ERL (now ERM) in 1992.
9
The
study’s remit was to look at the general applicability of economic instruments in the
field of waste management. Deposit refunds scored poorly in that they were not
considered applicable to the bulk of waste being managed.
In the second half of the 1990s, the UK introduced its own mechanism for seeking
to ensure compliance with the obligations placed upon EU Member States through
the Packaging Directive. The mechanism which eventually emerged, following a
protracted gestation, was based upon tradable ‘compliance notes’, though opinion is
somewhat divided as to whether the tradability of these compliance notes – the
Packaging Recovery Notes (PRNs) and the Packaging Export Recovery Note (PERNs)
- was intended at the initial design stage.
10
Since 1997, the existing system – which leads to periodic setting of new targets,
associated fluctuations in the value of the PRNs and PERNs in line with the relative
tightness of their supply relative to their demand, and periodic anxiety regarding
whether and if targets might be met - has been the focus of policy-related activity in
the UK. This is despite the fact that the system has a number of shortcomings.
Perhaps the most notable of these is that the bulk of the cost of compliance does
not fall upon those whom it should most obviously fall i.e. the producers and
consumers of ‘packaged’ products. Instead, taxpayers shoulder much of the burden
of compliance, so that there is no relationship between packaging consumption and
the contribution made to meeting the costs of compliance. There are obvious
alternatives which would readily rectify the situation, such as taking the means of
financing compliance outside the tax system and placing it upon consumption, so
effectively aligning the system with the well-established polluter-pays principle.
11
Notwithstanding the continuation of the existing policy (albeit with periodic
revisions), there have been a number of occasions where alternatives were closely
9
ERL (1992) Economic Instruments and Recovery of Resources from Wastes. HMSO, London
Environmental Resources Management (then ERL).
10
One of the authors of this report was involved in work for what was then the Department for the
Environment, Transport and the Regions (DETR) to explore the nature of the changes which might
usefully be made to capitalise on the de facto tradability of PRNs and PERNs (see ECOTEC (1998)
Packaging Regulations: gathering Evidence on PRNs and the Impact of the regulations on Local
Authority recycling, Final Report to DETR, June 1998), the point being that the scheme did not
obviously exhibit some of the fundamental prerequisites which might be expected of a rational
scheme of tradable ‘evidence’.
11
As discussed below, the Packaging Strategy claims that an independent group reviewed
alternatives and effectively determined that ‘variations’ on the existing scheme were superior. As we
discuss below, we have not been able to find the evidence referred to in the Packaging Strategy.

9
considered. In the Strategy Unit’s review of waste strategy in 2002, it was suggested
that:
12
Action is needed in the following five areas to put the right long term
economic and regulatory framework in place: […]
[…] new measures to encourage reuse, such as deposit-refund schemes and
designing civic amenity sites for re-use;
The document included a number of recommendations, one of which was as follows:
Recommendation 3: Defra and WRAP should consider the options for
increasing incentives for the re-use of goods. More work is needed to assess
the preferred means for different products and to establish where the impact
on the waste stream would be greatest.
Defra responded to the Strategy Unit’s recommendations in 2003. It noted, in
response to the recommendation regarding re-use:
13
The Strategy Unit has suggested deposit refund schemes as one way of
encouraging individuals to participate actively in reuse and recycling. Defra is
commissioning a joint study, with other interested departments, to update
previous work on the benefits and costs of such schemes with a view to
identifying the contribution they could make to increased reuse and recycling.
The study that was subsequently commissioned was undertaken by Oakdene Hollins
in 2004.
14
The findings of this study were somewhat divided, according to what the
DRS was trying to achieve. The study noted that using DRS as an effective
instrument for promoting re-use in the UK would probably not deliver the required
payback, given that the majority of packaging is already one-way in the UK, and
hence there would be significant expense associated with setting up the refillables
processing infrastructure, and producers would be likely to continue using one-way
packaging anyway.
However, on the positive side, the study reported that introduction of a DRS in the
UK on one-way packaging would generate an increase in recycling and a reduction in
litter, and that, based on their approach of calculating the expected costs associated
with achieving recycling targets using the existing policy mix, introducing a DRS was
found to generate a surplus for every option. The study noted that the overall costs
of running such a system would be highly dependent on the return rate of
containers, and that the ‘unclaimed’ deposits were the principle cause of the overall
surplus. Final positive notes from the study included the following:
12
Strategy Unit (2002) Waste Not, Want Not: A Strategy for Tackling the Waste Problem in England,
December 2002.
13
Defra (2003) Government Response to Strategy Unit Report ‘Waste Not, Want Not’, HMSO:
February 2003.
14
Oakdene Hollins (2004) Deposit Return Systems for Packaging: Applying International Experience
to the UK, report prepared for Defra, December 2004

10
A DRS targeted on light-weight containers, cans and plastic bottles, would
integrate well with the existing policy mix that provides incentives for Local
Authorities to collect heavy and/or biodegradable wastes.
Establishing a new social habit of returning containers to redeem deposits
may create a platform on which other more sustainable patterns of
consumption could be built in the future.
This study was subjected to a Peer Review by Perchards. This review made some
legitimate comments of a critical nature regarding the report. It picked apart the
distinction between European and US-type systems, and made cogent remarks
about the operations of DRSs for refillables. At the same time, it made some critical
remarks which seem slightly unfair towards the study, notably around the authors’
views regarding the effects of a DRS on the PRN market.
In conclusion, the authors noted:
15
We conclude that the report does not meet the project specification. We
cannot see how it could be used to aid policy formulation unless it was
completely rewritten.
This is a strong recommendation, and one which seems somewhat uncharitable. The
Peer Review report itself is not without flaws, some of them amounting to basic
misunderstandings. It is usually the nature of a peer review to seek to improve the
quality of a report in progress rather than to completely cast it aside. On the Oakene
Hollins recommendation that a DRS be applied to selected non-refillable beverage
containers, they state:
the information provided in the report to support this conclusion is muddled
and disjointed. Although they have recommended this option, the report
lacks a thorough discussion of how such a DRS might be structured, how it
would operate, and how it would be funded. We challenge the proposal that it
should be funded by unredeemed deposits since this would create an
economic incentive to the operators not to achieve a high return rate.
The latter comment is instructive given that elsewhere, the peer reviewers suggest
that at the specified level of deposit, the return rate proposed by Oakdene Hollins
might be too high. It is inconsistent to suggest on the one hand that the suggested
return rate is too high, yet on the other to criticise the consultants for suggesting
that a DRS might be funded through unclaimed deposits. As we highlight in the work
below, the likelihood that system costs are covered by the revenue from unclaimed
deposits becomes high at the low return rates which Perchards seem to suggest
should be used at the consultants’ proposed level of deposit.
A more recent review was carried out by ERM.
16
Although this later study does not
fully reference the Oakdene Hollins work undertaken following the Strategy Unit
review, it states, in describing the background to the project, that:
15
Perchards (2005) Deposit Return Systems for Packaging Applying International Experience to the
UK, Peer Review of a Study by Oakdene Hollins Ltd., Report to Defra 14 March 2005.

11
Defra commissioned a report on deposit schemes in 2004. Its basic findings
suggested that a deposit system would be problematic. However, there has
been renewed interest in the possible use of deposit systems and the use of
reverse vending as a collection method for beverage containers.
There is no indication as to why the previous study found DRSs to be ‘problematic’.
In passing, we note that the ERM study continued:
17
In particular, the Campaign to Protect Rural England (CPRE) supports the
introduction of a deposit system as a means to reduce litter. CPRE has
recently launched a campaign with this aim in mind.
The ERM study set out to answer a series of questions. The approach to providing
answers to these was based largely upon gathering opinion from organisations
involved in the packaging chain (see Jane Kennedy’s written statement in May
2009, quoted later in this section). There was no attempt to understand the cost
implications of the introduction of such a scheme, nor any serious attempt to
quantify potential benefits. These were considered outside the study’s scope.
Consequently, the evidence required in order to answer a number of key questions
was never provided. Somewhat surprisingly, this did not stop the authors from
offering answers to these questions, even in the absence of the necessary evidence
to support them. Furthermore, these unsubstantiated views were taken forward in
the subsequent Government thinking of the time.
ERM made the following closing comment in their study:
It is not disputed that a deposit scheme would increase recycling, but
alternative schemes could achieve the same or better results at a lower cost.
This is not demonstrated in their work, and as such can only be regarded as
speculation. The study includes no figures relating to the costs of intensifying
kerbside collection systems relative to the costs of implementing a DRS. It also
reaches the view that deposit schemes do usually achieve higher recycling rates
than other schemes, so the final comment regarding the achievement of ‘the same
or better results’ actually contradicts views expressed elsewhere in the report.
The closest the study comes to providing evidence in respect of costs is a single
paragraph containing no figures:
Providing financial support for the expansion of council collection schemes
offers a relatively cost-effective means of continuing the trend of improving
rates. Furthermore, the investment would cover a much wider range of
materials – not only certain beverage containers, but other items of
packaging, and non-packaging materials as well.
Notwithstanding the absence of evidence, the same message is restated in Defra’s
Packaging Strategy of 2009:
18
16
ERM (2008) Review of Packaging Deposits System for the UK, Final Report to Defra, December
2008.
17
ERM (2008) Review of Packaging Deposits System for the UK, Final Report to Defra, December
2008.

12
In July 2008, Defra commissioned consultants ERM to study the feasibility of
setting up a deposit scheme for drinks containers in the UK. The study
examined whether deposit schemes were likely to increase recycling and to
reduce litter. It considered the role of reverse vending, the possible impact of
deposits on existing collection systems, the issues that would need to be
considered in setting up a deposit system, and possible alternatives to
deposits. It looked at the experience of deposits in four countries – Denmark,
Germany, the Netherlands and Sweden – to draw lessons for a possible UK
scheme. The study concluded that deposit systems are likely to increase
recycling but that other measures may achieve the same goals more cheaply.
An effective deposit and return scheme could divert materials from existing
arrangements such as bottle banks or kerbside collections, which have been
developed, for the most part, with public funding.
Under a different take-back model, retailers could introduce their own bring
banks for a wide range of packaging materials. Tesco and Sainsbury’s have
both trialed this in various formats. On the positive side, this could be seen as
the logical extension of producer responsibility, relieving local authorities of
their duty to collect packaging waste. On the negative side, the ability to
provide this infrastructure is limited by space, and accessibility for
householders is likely to be an issue. Also, this would deprive local authorities
of a source of revenue by taking valuable recyclates away. Were this system
to replace local authority collections, it is likely that the amount of packaging
collected for recycling would drop, as the effort of getting the recyclates to
the collection points would be more onerous for the public than kerbside
collections.
Yet another model would be for retailers and manufacturers to complement
local authority provisions by setting up bring banks for items that may not
otherwise be widely collected by local authorities. This has been done by the
carton industry body ACE UK (Alliance for Beverage Cartons and the
Environment) to ensure that cartons, such as those made by Tetra Pak are
widely collected across the UK. Deposit and bring systems which involve
human interaction tend to result in high quality materials. The design of
unsupervised bring banks makes a significant difference to their use and
contamination.
Unless take-back provisions are made mandatory, and cover the range of
materials which is currently being collected by local authorities, local
authority collections would need to continue in parallel. Overall, the operation
of two parallel systems is likely to increase costs to consumers and
taxpayers, with uncertain results on the quantities collected.
Some of this is based on supposition, whilst other statements present only half the
picture. The statements to the effect that local authorities would lose a source of
revenue, and that the operation of two parallel systems would likely increase costs,
are both statements which reflect only part of the overall picture. They make no
18
Defra (2009) Making the Most of Packaging: A Strategy for a Low-carbon Economy, June 2009

13
reference to the possible savings on logistics, and on sorting of local authority
collected materials, which would occur if a deposit scheme was introduced. They
also fail to take into account any additional benefits the scheme could provide.
The Packaging Strategy discussed deposit schemes as an alternative means to fund
packaging recycling. It noted:
In the second half of 2008, the independent Packaging Recycling Action
Group (PRAG) set up a working group to look at funding mechanisms. It
compared variations on the last three options above [ie. including deposit
refunds] against a set of criteria including, among other things, the likely
effectiveness of each option in terms of increasing quality and quantity, value
for money, ease of implementation and visibility to consumers and local
authorities. Variations on the current system consistently scored higher than
the alternatives.
There is no report arising from the PRAG working group referenced in the Packaging
Strategy. We have not been able to track down any document which arrived at this
view, and indeed, our attempts to do so suggest that the view attributed to the PRAG
– that variations on the current system offered the best way forward – does not
accurately represent the views expressed by the PRAG.
A briefing from the Industry Council for Packaging and the Environment (INCPEN)
may be referencing the same group when it states:
19
A group advising the UK government concluded recently that a deposit
system could cost between £1 billion and £7 billion to establish, depending
on how the system was set up.
The basis for this estimate is not made clear, and again, there is no study
referenced. The breadth of the range in the cost estimate suggests that the analysis
was a cursory one.
Similar lines have been taken by Ministers in Written Answers to Parliamentary
Questions. The then Environment Minister responded as follows to a written
question on 13 May 2009:
20
Mr. Drew: To ask the Secretary of State for Environment, Food and Rural
Affairs (1) what steps he has considered to increase levels of plastic and
glass bottle recycling; if he will bring forward proposals to promote bottle
return schemes in shops; and if he will make a statement; [273465]
(2) what measures he has considered to increase levels of plastic and glass
bottle recycling; what consideration he has given to tax incentives for (a)
companies who recycle, (b) companies who do not and (c) the promotion of
bottle return schemes in shops; and if he will make a statement. [273380]
19
Incpen (2008) Mandatory Deposits on Packaging, May 2008.
20
Written Answers to Questions, Wednesday 13 May 2009 Column 757W
http://www.publications.parliament.uk/pa/cm200809/cmhansrd/cm090513/text/90513w0001.ht
m#09051353000016

14
Jane Kennedy: […] In December 2008 DEFRA published a report into
packaging deposit systems and the role they might play in increasing
recovery and recycling of single use drink containers (plastic, aluminium and
glass) in the UK. The report was completed in consultation with a range of
industry stakeholders and reviewed deposit systems in four other EU member
states to assess the implications of introducing such a system in the UK.
The report concluded that while deposit schemes would increase recycling,
alternative schemes could achieve the same or better results at a lower cost,
as the relative cost of introducing a deposit scheme system was high. For
example, the deposit scheme operating in Germany costs three times as
much per container as a household collection system.
However, the Government are keeping an open mind in regard to deposit
schemes and ‘reverse vending’, where vending machines take used bottles
and cans for recycling and usually give a reward such as supermarket loyalty
points or vouchers. A number of reverse vending systems are being set up by
major retailers and the performance of these systems is being monitored.
It is not possible to speak about what is or is not ‘relatively cost effective’ without
knowing what the relative costs are. We have seen no information from any study
which would suggest that work to understand the relative costs has actually been
undertaken.
2.1 Scotland
The Climate Change (Scotland) Bill contains powers to introduce deposit and return
schemes in Scotland. In a consultation on legislative measures to implement a zero
waste policy, the Scottish Government recommended this in 2008.
21
However, this recommendation was diluted by the time of the consultation on the
Zero Waste Plan:
22
As outlined throughout the draft Plan, the Government, working with
partners, is already taking steps to improve recycling facilities across
Scotland and plans to take further steps.
For example, section 3.6 of the draft Plan notes that the Scottish Government
is convening a round table to consider what more could be done to establish
recycling zones in public places right across Scotland. If voluntary measures
to increase recycling should not succeed, then the Scottish Government
would consider if the regulatory route should be followed.
In the final version of the plan, there is no mention of DRSs, though there is mention
of a study to review options for ‘extended producer responsibility and “take-back”
schemes in Scotland.’
23
21
Scottish Government (2008) Consultation on Legislative Measures to Implement Zero Waste, July
2008, http://www.scotland.gov.uk/Resource/Doc/1056/0063943.pdf
22
Scottish Government (2009) Scotland’s Zero Waste Plan: Consultation, Annex N - Packaging,
August 2009, http://www.scotland.gov.uk/Resource/Doc/282143/0085295.pdf

15
2.2 Summary View
The apparently established line that alternatives to deposit refunds could achieve
the same or better results at lower cost than a deposit scheme remains to be clearly
demonstrated. Although it is suggested, in the previous Minister’s response, that the
past Government retained an open mind on this matter, the ease with which its
mind seems to have been closed contrasts with this avowed openness. The view of
ERM, and the opinions subsequently expressed by Defra and its Ministers, appears
to lack any firm basis.
There is a clear need for some objective assessment of what the relative costs, and
benefits might be for DRSs. This study is intended to fill this gap with regard to the
UK.
3.0 Economic Rationale for Deposit Refund
Schemes
DRSs are a particular form of product tax/recycling subsidy. In such programmes,
also known as ‘bottle bill’ programmes, consumers pay a deposit (tax) on a
container at the time of purchase. This should, in theory, be set at the extra social
cost of improper disposal over the net recycling cost (assuming there is already an
Advance Disposal Fee (ADF) on the manufacturer equal to the net recycling cost).
This means that if the product is improperly disposed of, that individual pays the
external cost of improper disposal by foregoing the refund, which would typically be
set equal to the initial deposit. As with many environmental policy instruments, the
theory is somewhat simpler than the practice. As we discuss later in the report, for
example, the basis for valuing the social cost of improper disposal is not as strong
as one would like.
The distinction between DRSs on the one hand, and ADFs coupled with a household
recycling refund on the other, is in the re-collection of the product at the end of its
useful life. Deposit schemes generally involve a separate collection path, rather than
being collected as part of the municipal recycling system.
Several theoretical studies have argued that a deposit/refund is the best policy in
the presence of illegal disposal.
24
Palmer et al modelled paper, glass, plastic,
aluminium, and steel. They found a substantial difference in the intervention levels
necessary to achieve reductions in disposal with the various policies. A $45/ton
deposit /refund would reduce all wastes by 10%. Alternatively, the government
23
Scottish Government (2010) Scotland’s Zero Waste Plan, June 2010,
http://www.scotland.gov.uk/Resource/Doc/314168/0099749.pdf
24
T. Dinan (1993) Economic Efficiency Effects of Alternative Policies for Reducing Waste Disposal,
Journal of Environmental Economics and Management 25: 242–56; D. Fullerton and T. C. Kinnemann
(1995), Garbage Recycling and Illicit Burning or Dumping, Journal of Environmental Economics and
Management, 29 (1); Peter S. Menell (1990) Beyond the Throwaway Society: An Incentive Approach
to Regulating Municipal Solid Waste, Ecology Law Quarterly, vol. 17, pp. 655-739; Hilary Sigman
(1995) A Comparison of Public Policies for Lead Recycling, RAND Journal of Economics, vol. 26, no. 3
(Autumn), pp. 452-478.

16
could obtain a comparable reduction using an ADF of $85/ton or a recycling subsidy
of $98/ton.
A key point is that the deposit/refund creates incentives for both recycling and
source reduction, whereas an ADF or a recycling subsidy takes advantage of only
recycling or source reduction in isolation.
25
However, it is important to note that the
theoretical studies, in abstracting from the real world situation, have not taken into
account all the potential costs of administering such schemes. In fact they are not
precisely modelling existing ‘bottle bill’ programmes, but rather a more generalised
version of deposits and refunds, applied ‘upstream’ on manufacturers and recyclers.
In a further study, Palmer and Walls accept that in practice there could be
significant administrative costs associated with refunding deposits, which could
reduce the efficiency of the approach.
26
This issue is discussed by Palmer et al with
numerical estimates of the effects of administrative costs on the overall efficiency of
deposit refunds relative to product taxes and recycling subsidies.
27
Viewing their
results alongside empirical evidence from Ackerman et al., they suggest that
administrative costs may be of the same order as the cost savings from using a
deposit/refund.
28
Due to such considerations, Palmer et al., Fullerton and
Kinnaman, and Palmer and Walls all argue that deposit refunds should be imposed
upstream on producers rather than on final consumers to minimise administration
and transaction costs.
29
Most theoretical studies recommend DRSs as economically efficient mechanisms to
increase rates of recycling.
30
This includes UK-based reviews, such as that
undertaken by Turner et al (1996) which stated:
31
25
K. Palmer, H. Sigman and M. Walls (1997) The Cost of Reducing Municipal Solid Waste, Journal of
Environmental Economics and Management 33, 128-50.
26
Palmer and Walls (1997) Optimal Policies for Solid Waste Disposal Taxes, Subsidies and
Standards. Journal of Public Economics 65(8): 193-205.
27
K. Palmer, H. Sigman and M. Walls (1997) The Cost of Reducing Municipal Solid Waste, Journal of
Environmental Economics and Management 33, 128-50.
28
Frank Ackerman, Dmitri Cavander, John Stutz, and Brian Zuckerman (1995) Preliminary Analysis:
The Costs and Benefits of Bottle Bills, Draft report to U.S. EPA/Office of Solid Waste and Emergency
Response, Boston, Mass.: Tellus Institute.
29
D. Fullerton and T. C. Kinnemann (1995), Garbage Recycling and Illicit Burning or Dumping, Journal
of Environmental Economics and Management, 29 (1); Palmer et al (1997); Palmer and Walls
(1997).
30
See, for example, Dinan, T.M. (1993) Economic Efficiency Effects of Alternative Policies for
Reducing Waste Disposal, Journal of Environmental Economics and Management, 25: 242-256.;
Fullerton, D. and Kinnaman, T. (1995) Garbage, Recycling and Illicit Burning or Dumping, Journal of
Environment Economics and Management, 29: 78-91; Pearce, D.W. and R.K. Turner (1993) Market-
based approaches to solid waste management, Resources, Conservation and Recycling 8: 63-90.
Porter, R.C. (1978) A Social Benefit Cost Analysis of Mandatory Deposits on Beverage Containers,
Journal of Environmental Economics and Management, 5: 351-375. Sigman, H. (1995) A Comparison
of Public Policies for Lead Recycling, Rand Journal of Economics 26: 452-478; Thomas Skinner and
Don Fullerton (1999), The Economics of Residential Solid Waste Management, NBER Working Paper
7326 http://www.nber.org/papers/w7326
; K. Palmer and M. Walls (1999) Extended Product
Responsibility: An Economic Assessment of Alternative Policies, Discussion Paper 99-12, January

17
The environmental economics literature has analysed the relative merits, in
economic efficiency terms, of a number of economic instruments and
regulatory approaches to the solid waste disposal and recycling balance issue
(Dinan, 1993; Fullerton and Kinnaman, 1995; Sigman, 1995). The general
finding was that policies focusing only on input use or on waste outputs
cannot generate the optimal (economically efficient) balance between
recycling, disposal and production output. Thus recycling subsidies directed at
input use cannot generate the efficient amount of waste disposal unless
coupled with a tax or subsidy on consumption. Primary product taxes need to
be coupled with both an output tax and a tax on other production inputs to be
economically efficient. A regulatory measure such as a recycling content
standard also cannot generate the efficient level of output and waste disposal
unless it is augmented by taxes on other inputs to production, together with
either a tax or a subsidy on the final product. Acquiring the detailed firm-
specific information necessary in order to set the efficient levels of taxes and
standard is clearly not a practicable proposition for public policy makers.
This same body of analysis finds that the deposit-refund instrument (in which
the product tax and the refund are equal to the marginal social cost of waste
disposal) is an efficient mechanism and is equivalent to taxing disposal (for
nonreturners) but without the attendant illegal disposal problems. The
efficiency advantage of the deposit-refund instrument will in practice be
reduced the higher the administration and consumer inconvenience costs
involved. (Porter, 1978; Pearce and Turner, 1993). […]
The waste management policy area is one in which a greater use of economic
instruments does seem warranted. The combination of landfill tax and
recycling credits to be introduced in the UK is in a rough and ready way a step
in this direction. This policy reorientation is however only partial and
efficiency gains still remain untapped, given the fact that the landfill tax does
not reflect the full social costs of waste disposal in the UK. Economic analysis
finds the deposit refund instrument to be highly rated in economic efficiency
terms and also has applications in some hazardous waste problems.
The theoretical case in favour of deposit refunds appears, therefore, to be quite
compelling.
3.1 Summary View
One could be forgiven for being surprised – given the generally supportive view in
respect of the theoretical literature – that deposit schemes are not more widely
applied than they already are. However, the theoretical studies tend to be
considered abstract from reality, in that they do not fully consider the costs of
1999, Washington DC: Resources for the Future; Don Fullerton and Amy Raub (2003) Economic
Analysis of Solid Waste Management Policies, in OECD (2004) Addressing the Economics of Waste,
Paris: OECD.
31
R. Kerry Turner, J. Powell, A. Craighill (1996) Green Taxes, Waste Management And Political
Economy, CSERGE Working Paper WM 96-03.

18
administering such schemes in real terms. Once again, this highlights the need for
studies which consider the range of possible costs and benefits which may be
associated with DRSs.
4.0 Possible Benefits of Deposit Refund
Schemes
DRSs are reported, in the literature, to have a range of possible environmental
benefits. The key ones mentioned in the literature are:
1. Increasing the recycling of containers covered by deposits (for refill or
recycling);
2. Reducing the extent of littering;
3. Increasing the use of / reducing the extent of decline in the use of refillables;
and
4. Avoiding harmful chemicals being mobilised in the environment (usually not
in beverage schemes, eg. lead acid batteries, or pesticides).
In addition, there are likely to be some effects on the efficiency of logistics with
regard to both kerbside collections and the DRSs. Significantly, this study uses
logistics modelling to understand how the costs of household waste collections
change when the DRS is put in place, as well as to establish the key drivers in terms
of the logistics costs of the DRS itself. To our knowledge, no study has carried out
this work in a satisfactory manner.
In the discussion that follows, we consider the literature in respect of the first two
issues. The third, regarding refillables, is not a key aspect of the scheme we propose
(see below).
32
The fourth does not obviously apply to packaging, though there is
some evidence to suggest that the effects of packaging on the marine environment
do indeed give rise to such concerns (touched upon below in the consideration of
effects on littering).
4.1 Increasing Recycling
Ideally, one has some indication of ‘before’ and ‘after’ performance, controlling for
other variables. To some extent, this is made difficult by the absence of usable data.
Surprisingly few studies actually take this approach.
Some data allows for comparison of performance in areas with and without
deposits. In the US, in 1999, the recycling performance of states with and without
deposits in place is shown in
Figure 4-1. The recycling rates, and the number of
containers recovered per capita, were far higher in the deposit states. However, this
could simply be evidence of the absence of adequate collection infrastructure in the
no-deposit states, so it cannot be considered as robust evidence.
32
For a discussion regarding the refillables issue, see Eunomia et al. (2009) International Review of
Waste Management Policy: Annexes to Main Report, Report for Department of the Environment,
Heritage and Local Government, Ireland, September 2009.
19
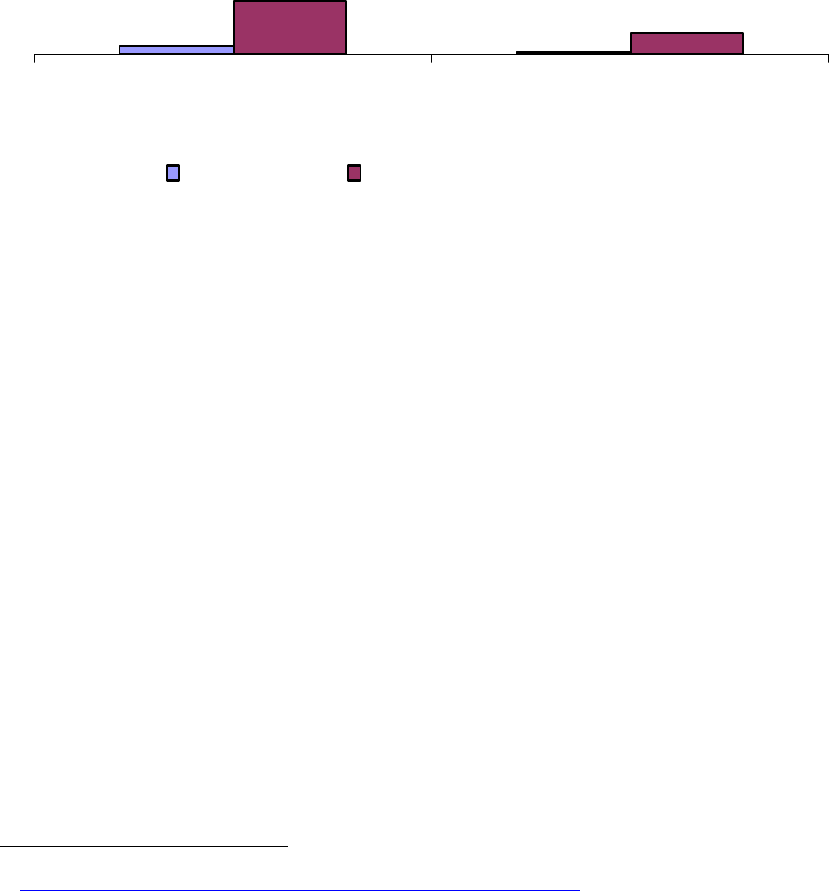
Figure 4-1: Performance of US States With and Without Deposits, 1999
Recycling rate (%) and per capita containers
recovered in the US (1999)
72
28
490
191
Deposit states (10) Non-deposit states (40)
Recycling rate Containers per capita recovered
Of some interest is the performance of deposit schemes in the context of wider
recycling systems. In Sweden, for example, the recycling rate for all plastic
packaging increased from 17% to 30% between 2003 and 2005 (44% in 2006). In
the same period, recycling rates for Polyethylene terephthalate (PET) plastics under
the deposit scheme were 77% to 82% (85% in 2007).
Once again, this, in and of itself, might not prove much. The components of plastic
packaging are many and varied, and PET bottles are readily recyclable. Perhaps
more telling, however, is the performance in respect of metals. Recycling rates for
all metal packaging were around 65% in 2004-2005, but the recycling rate for
aluminium under the DRS was 85% to 86% in the years 2002 to 2007. The return
rate for glass bottles is 99% on 33cl bottles and 90% on 50cl bottles.
33
In Denmark,
return rates in 2007 were 84% for cans, 93% for plastic bottles and 91% for glass
bottles.
34
Similarly, in Germany, recycling rates in 2005 were 50%, 85%, 76% and 79% for
plastics, tinplate, aluminium and glass respectively. The reported return rates under
the deposit scheme are 95-99%.
35,36
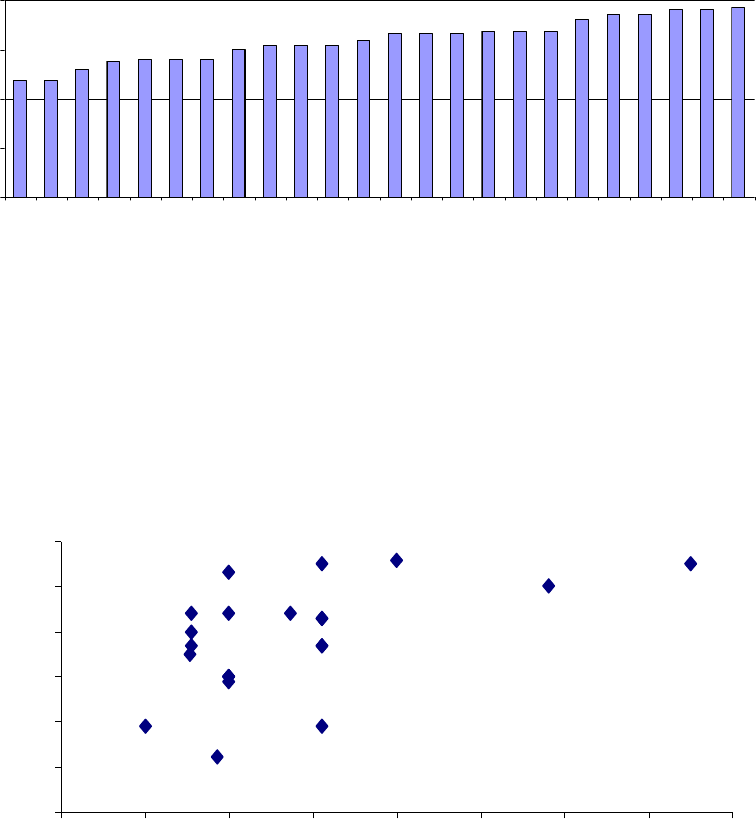
Figure 4-2 shows collection rates achieved in 2002 by international deposit
schemes. This shows that very few countries see low rates of return, with some
jurisdictions achieving close to 100% return rates. As would be expected under
economic theory, deposit scheme return rates increase as the deposit increases,
33
http://www.sverigesbryggerier.se/eng/1-emballage/1-index.html, accessed January 2009.
34
ERM (2008) Review of Packaging Deposit Systems for the UK, Report for DEFRA, December 2008,
accessed from http://randd.defra.gov.uk/Document.aspx?Document=WR1203_7722_FRP.pdf
35
Wolfgang Ringel (2008) The German Deposit System on One Way Beverage Packaging,
Presentation to the first Global Deposit Summit, Berlin 2008.
36
Data from the DPG (Deutsche Pfandsystem GmbH (System Operator)) in March 2010 puts
the 2009/10 return rate for PET bottles at 98.5%.
20
with higher deposits leading to an enhanced incentive (see Figure 4-3). Figures for
Denmark are shown in Figure 4-4.
Figure 4-2: Collection Rates for Non-refillable Containers in Deposit Systems, 2002
Note: Figures based on data collected from system operators, data from 2002
Source: Wolfgang Ringel (2008) Introduction on Deposit Refund Systems, Scottish Government Litter
Summit, Edinburgh 26
th
November 2008.
Figure 4-3: Relationship Between Level of Deposit and Return Rate
40
50
60
70
80
90
100
0,0 2,0 4,0 6,0 8,0 10,0 12,0 14,0 16,0
Deposit (€ cents per container)
Collection rate (% )
Source: System operators, Container Recycling Institute, Data from 1997-2002
Collection rate in deposit systems for non-refillable containers (%)
59 59
65
69
70 70 70
75
77 77 77
80
83 83 83
84 84 84
90
93 93
95 95
96
0
25
50
75
100
California
Prin ce
E
dward
New
F
oun
dland
Massachusetts
Connec
ti
cut
Maine
New Yo rk
S
ou
th A
ustr
alia
N
ew
Brunswick
On
tar
i
o
Quebec
A
lber
ta
D
enm
ark
Nova Scotia
Saska
tc
hewan
B
r
i
t
i
sh Columb
i
a
Oregon
Swed
en
Vermon t
Iowa
N
or
way
Finland
M
anitoba
Michigan

21
Figure 4-4: Return Percentages of One Way & Refillable Beverages in Denmark
Source: Christian Fischer (2008) Producer Responsibility Schemes Versus Deposits and Taxes- Danish
Experiences, PRO Europe Congress, 15 May 2008
Taiwan differs from the European context, as the deposit refund scheme started
without any other producer responsibility systems in place. The scheme therefore
acted in isolation to increase recycling, first of PET and later with a number of other
materials. Taiwan now claims a 100% PET recycling rate, using its DRS.
Some have suggested that it is not the case that recycling rates are higher under
deposit schemes. However, those who suggest this usually do so on the basis of
reviewing recycling rates for all packaging. For example, the European Organisation
for Packaging and the Environment (EUROPEN) argues:
37
There are no compensating benefits with regard to an overall improvement in
recycling performance. The Perchards report showed that overall recycling
rates in Member States with deposit systems are not higher than those of
comparable EU countries where there are no special arrangements for
beverage containers.
Deposits, however, do not apply to all packaging. The Perchards report itself
states:
38
It is certainly true that deposit systems for non-refillable beverage containers
can achieve higher recycling rates for the beverage containers affected than
when these containers are handled through general recycling systems.
However European experience shows that deposit systems do not achieve a
37
EUROPEN (2007) Economic Instruments in Packaging and Packaging Waste Policy, Brussels:
EUROPEN.
38
G. Bevington (2008) A Deposit and Refund Scheme in Ireland, Report commissioned by Repak Ltd.,
September 2008.

22
higher recycling rate for all packaging of a given material, because beverage
containers represent too small a proportion of the total tonnage of that
packaging material.
Drinks containers typically represent only about 10% of all packaging and the
recycling rate for beverage containers in general recycling systems is likely to
be higher than the recycling rate for all packaging of the same materials.
The report then alludes to the performance of Belgium in respect of the recycling of
all packaging even though this is clearly not a good comparator for reasons which
the previous extract makes clear (the targeted materials – beverage containers –
are a relatively small fraction of all packaging). In particular, the largest fraction of
the packaging stream is always paper and card, which is also an easy, and relatively
low cost, material to recycle. Consequently, in most countries, the packaging
recycling rate will be heavily influenced by capture of a material that is irrelevant to
any sensible discussion regarding DRSs.
Perchards responded to a similar criticism in a previous report, where they had
earlier suggested that the recycling rates achieved in deposit schemes were no
greater than those achieved in other countries through presenting targets related to
all packaging.
39
They responded:
We decided to make a comparison based on overall recycling rates achieved
because the Packaging and Packaging Waste Directive repealed the Directive
on containers of liquids for human consumption, reflecting that the scope of
policy has broadened out to all packaging. A further expansion and/or
restructuring of EU policy is now under consideration which may result in
targets for all products of specific materials. Thus, specific arrangements just
for beverage containers go against the trend in EU policy in this area.
GRA has challenged our line of argument, saying that the fact that deposit
systems handle only a small amount of packaging is no reason not to have a
deposit system. GRA used a medical analogy to illustrate argument – if you
have a medicine that can cure 10% of the patients, but not the other 90%, is
there a reason not to use the medicine for the 10%? However, this is not an
exact analogy, because a medicine does exist for a significant proportion of
the other 90% of packaging, namely selective collection.
Several other stakeholders have also challenged the basis of our comparison,
arguing that a clearer picture would emerge from a comparison based on
recycling rates for household packaging waste alone, or, even better, of
beverage containers between deposit states and Member States relying on
packaging recovery systems. Unfortunately, though, we were not able to
obtain data which would have enabled us to pursue this suggestion.
This argument fails to counter the possibility that it might be possible to design a
system which targets the 10% through one system and targets the remaining 90%
through another. No one advocating DRSs is necessarily arguing against ‘selective
collection’ of, for example, cardboard or wood. Equally, several successful selective
39
Perchards (2005) Study on the Progress of the Implementation and Impact of Directive 94/62/EC
on the Functioning of the Internal Market, Final Report to the European Commission, May 2005.

23
collection systems for packaging – notably the Belgian one - achieve high rates of
recycling without targeting non-bottle plastics from households.
So, the question remains open as to whether a complementary system or, when
correctly modelled, a parallel system of selective collection and DRS might be
superior to either one acting independently. The rather obvious point is that the
costs of an existing recycling system are unlikely to remain the same when
substantial quantities of generally low density beverage packaging are no longer
being collected. This question has only really been examined in one study as far as
we are aware (see later in this Section). Generally, the question regarding costs has
not been properly answered for the simple reason that the question which really
matters has not been interrogated in sufficient depth. This research attempts to
shed light upon what the implied changes in costs and benefits might actually be.
This is not to deny the possibility of high recycling rates of packaging being achieved
without DRSs. Other EU countries, such as Belgium, have achieved impressive
recycling performance without them. Based on its Fost Plus managed packaging
collection system, Belgium recycled 67% of plastic bottles in 2007 (comprising both
Polyethylene terephthalate (PET) and High-density polyethylene (HDPE)) and 97.5%
of metal packaging (steel and aluminium cans).
40
Belgium has a producer
responsibility scheme in place which is fully funded by obligated industry. It also sets
targets well above those prevailing in the UK at present, and also has near-universal
implementation of so-called ‘pay as you throw’ schemes at the household level, a
policy which the Coalition Government has clearly set itself against. One might still
argue, even in this case, that there might be room for improvement through use of a
deposit scheme where plastic bottles are concerned.
In the UK, Alupro, the aluminium industry’s trade body, says 98% of English
households have kerbside collections of aluminium cans, but capture rates can be
anywhere between 30% and 70%.
41
The ‘cans-only’ recycling rate was estimated to
be 52% in 2008.
42
Therefore, even with a ‘free to the consumer’ system (in terms of
marginal cost), and very widespread coverage, the capture rate is still much less
than is seen in countries with a DRS. This may be partly a reflection of the fact that
35% of aluminium cans are consumed away from home, in the workplace, and at
sports, leisure and travel locations, according to Alupro. Consequently, this waste
stream would be one for which DRSs may be well suited, not least since such
containers would subsequently then be less likely to arise as litter, with individuals
encouraged to recycle whilst ‘on the go’ in order to claim back their deposits.
For plastic bottles, according to RECOUP, with 18.1 million (72%) of the UK’s
26 million households receiving kerbside collections (and bring schemes also in
place), the recycling rate in 2009 was 39%. If the same average performance was
maintained, the recycling rate would increase to 55% under universal coverage by
40
Fost Plus (2007) Annual Report, http://www.fostplus.be/files/EN/8/GB_AR.pdf
41
Ends Report (2009) Defra Report Rejects the case for Bottle Deposits, January 2009
http://www.endsreport.com/index.cfm?action=report.article&articleID=20119&q=deposit%20refund
&boolean_mode=all
42
Alupro website, http://www.alupro.org.uk/facts%20and%20figures.htm, accessed May 2009.

24
kerbside services. The 55% figure appears to be well below what is routinely
achieved by DRSs, though it must be stated that the RECOUP data covers all plastic
bottles, whereas deposit schemes do not always cover 100% of all plastic bottles
(see Section 5.2 below).
4.2 Effects on Littering
There is evidence to suggest that deposit refund policies can reduce litter and even
reduce the number of lacerations caused by glass in the environment.
43
Several one-
way deposit systems were implemented with the clear objective of reducing littering
(eg. Sweden, British Columbia, California, Michigan and others, with Hawaii a more
recent example of this trend). The potential for DRSs to be effective in reducing
littering has an intuitively plausible rationale - if the deposit is significant and the
consumer does decide to litter, the possibility exists that someone else will pick up
the container to redeem the deposit. INCPEN suggests that this can worsen the litter
situation in some cases. They make the statement that:
44
Perversely, a deposit can contribute to the litter problem. There have been
reports of homeless people emptying litter bins to obtain deposit containers,
leaving other items on the street.
There is no evidence offered to support this view.
The Container Recycling Institute suggested significant reductions in littering
following the introduction of deposits in some US states (see Figure 4-5). The effects
on used beverage containers (UBCs) and on total litter are shown as being between
70-80% and 30-40%, respectively. It must be said, however, that all studies of this
nature suffer in terms of the lack of clarity about the metric used to measure the
contribution of beverage containers to total litter. It is not clear what the most
relevant indicator should be (counts, volume, hazardousness, etc.) partly because no
systematic studies have been carried out, to our knowledge, to understand the
contribution of different attributes of litter to the disamenity suffered by those who
experience litter. There is also the significant matter of cost to be considered since
clearing litter costs an ever-increasing amount of public money. Indeed, recent
figures from the Department of Communities and Local Government show that the
amount spent by local authorities in England on cleaning up litter and street
cleansing rose by almost £100M in the last year to £858M in 2009/10.
45
43
M. Douglas Baker, MD, Sally E. Moore, and Paul H. Wise, MD, PhD, MPH, "The Impact of 'Bottle Bill'
Legislation on the Incidence of Lacerations in Childhood", American Journal of Public Health, October
1986.
44
Incpen (2008) Mandatory Deposits on Packaging, May 2008.
45
http://communities.gov.uk/publications/corporate/statistics/financialstatistics202010

25
Figure 4-5: Reduction in Littering in US States Linked to Deposit Schemes
Reduction of littering in 6 US states after the introduction of container
deposit systems.
0
20
40
60
80
100
UBC litter reduced Total litter reduced
NY OR VT ME MI IA
70%~80% reduction
30%~40% reduction
• Deposit on one-way
containers reduces
UBC littering by 70-
80%
• Deposit on one-way
containers also
reduces the total
amount of littering by
30-40%
Source: Container Recycling Institute, USA
The Policy Exchange and CPRE report, Litterbugs,
46
cited a study suggesting litter in
New York State declined by 30% in the wake of the use of a DRS.
47
Over the past 25
years, according to official figures, the New York State Returnable Container Act
1983:
1. Reduced container litter by 70-80% and roadside litter by 70%;
48
2. Achieved redemption rates between 65-80%.
49
Where counter-arguments to the ‘litter reduction’ effect are put forward, these very
rarely challenge the likely reality of this effect. Indeed, the counter-arguments tend
to adopt the view that this effect is not significant because beverage containers
constitute only a small proportion of litter.
Even if one accepts the argument that this might be true, implicit in the counter-
argument appears to be an assumption that if litter ‘is there’, then the amount of it
is not a matter of any importance, or more specifically, that the reduction in the
quantity of beverage packaging in litter is of no significance. Yet none of the
literature actually offers any evidence to support this implied claim. The validity of
the implied claim is also affected by the nature of the assumption (as highlighted
above) concerning the metric used to measure ‘litter’. What the right metric might
46
Policy Exchange and CPRE (2009) Litterbugs: How to Deal with the Problem of Littering, London:
Policy Exchange, 2009.
47
New York Public Interest Research Group, www.nypirg.org/enviro/bottlebill/myths.html ; Bottle
Bill Resource Guide, www.bottlebill.org/legislation/usa/newyork.html
48
Kruman J, Bottle Bill at 25, New York State Conservationist, August 2007, New York State
Department of Environmental Conservation, www.dec.ny.gov/chemical/8500.html
49
New York State Department of Environmental Conservation Beverage Container Deposit And
Redemption Statistics: October 2004 - September 2005, 2006.

26
be has not, as discussed above, been given adequate consideration by either
advocates, or detractors, of the effects of deposit schemes.
Generally, the argument tends to be that beverage containers are a small fraction of
litter, and that therefore, eliminating this would not solve the litter problem. A
limitation of this argument is that it assumes that the relevant indicator regarding
litter is the measure used in the surveys referred to, typically, ‘counts’ of litter.
It could easily be argued that the disamenity effect of litter is as much a function of
its volume, and possibly its potential to persist, than simply the number of items (ie.
the counts). Given the relative insignificance – in volume terms – of chewing gum
and cigarette ends, it could be considered that beverage containers actually
contribute significantly to litter-related disamenity due to their contribution to the
visibility of litter.
For example, a 2008 survey by ENCAMS for INCPEN highlighted that there were
44,040 counts of cigarette butts as compared with 582 counts of beverage
containers (201 counts of ‘soft drinks cans, 188 soft drink plastic bottles, and 90
alcohol cans, 44 alcohol glass bottles, 43 drinks cartons, 9 alcohol cartons, 4
alcohol plastic bottles and 3 soft drink glass bottles (see Table 4-1)). An article by
Register suggests that 20 cigarette butts occupy a volume of 10ml.
50
The 44,040
butts would occupy, therefore, 22.02 litres. By contrast, the bottles and cans would
occupy around 163 litres in their uncompacted form. In other words, though
accounting for around 1.5% of the counts as compare with cigarette butts, they
would occupy around seven times the volume in their uncompacted form. The
plastic bottles alone (which are less readily compacted than, for example, cans)
would occupy more than three times the volume of the cigarette butts at an average
size of 330ml (which could be an underestimate). This highlights the fact that if
count data is a poor proxy for perceived impact of litter, and if volume is a more
appropriate one, then beverage packaging is a significant contributor to litter, this
being disproportionately large relative to its prevalence in surveys based only on
‘counts’.
Table 4-1: Raw Data from ENCAMS 2008 Survey for INCPEN
Type of Litter Count Type of Litter Count
Gum Staining 175,690
Drinks Cartons 43
Cigarette Ends 44,040 Comm. Warehouse Packaging 40
Sweet Wrapper 916 Other Paper Litter 38
Cigarette Related 366 Post Office Elastic Bands 34
Other Litter 335 Drinking Straws 29
Discarded Food & Drink 220 Commercial Industry
Packaging
24
Soft Drink Cans 201 Commercial Office Packaging 24
Plastic Soft Drink Bottles 188 ATM Receipt 17
50
Kathleen M. Register (2000) Cigarette Butts as Litter—Toxic as Well as Ugly, "Underwater
Naturalist", Bulletin of the American Littoral Society, Volume 25, Number 2, August 2000,
http://www.longwood.edu/cleanva/ciglitterarticle.htm

27
Fast Food Packaging 188 Lottery Related 16
Soft Drink Bottle Tops 183 Commercial Packaging 16
Snack Packaging 168 Match Boxes 14
Matches 135 Commercial Flyers 11
3D Gum 118 Other Travel Tickets 9
Tissue 93 Cartons for Alcohol 9
Alcohol Drinks Cans 90 Construction other Materials 8
Till Receipts 85 Warehousing other Materials 6
Other Materials 79 Commercial Office other
Materials
6
Carrier Bags 78 Paper Bags 4
Travel Tickets 67 Plastic Bottles for Alcohol 4
Alcoholic Bottle Tops 60 Commercial Food Other 4
Drink Cups 52 Commercial Construction Pack 4
Lolly/Ice Cream Related 51 Batteries 3
Gum Wrappers 50 Commercial other Retail 3
Discarded Newspaper 47 Soft Drink Glass Bottles 3
Glass Alcohol Bottles 44 Telephone Related 2
TOTAL 223,915
Source: ENCAMS (2009) Litter Composition Survey of England, Aug-Oct 2008, report
for Incpen, March 2009.
In their review of the Oakdene Hollins report for Defra, Perchards were critical of the
study’s examination of the effect of deposit refunds on litter even though the
principal objective of the study was, as noted by Perchards to “ascertain either of
these approaches [ie. DRS for reuse and/or for recycling of packaging] will confer
positive benefit over and above current policy approach to managing” packaging
waste.” It is difficult to understand why this would not be a legitimate area of inquiry
given the overriding objective, but Perchards state:
51
‘litter abatement was not referred to in the Defra specification, and we
wonder why it was discussed so thoroughly’.
Interestingly, they themselves enter the debate around litter, highlighting, as they do
so, work from the US which demonstrated that DRSs have, on average, the effect of
eliminating 81% of all deposit-related litter in the US.
They also show results for litter reduction in the US, drawing on the work of Syrek,
which highlights the difference in the effect of DRSs when the effect on litter is
considered from the perspective of items, or from the perspective of volume. Studies
relying on counts indicate that DRSs may have a small impact if large numbers of
other items are present. On a volume basis, however, DRSs seem to achieve, in the
figures highlighted by Perchards, a reduction of the order of 33-38% in total litter
(the figures can exceed 30% on an item basis too).
51
Perchards (2005) Deposit Return Systems for Packaging Applying International Experience to the
UK, Peer Review of a Study by Oakdene Hollins Ltd., Report to Defra 14 March 2005

28
These figures hardly look like the basis for an argument not to examine the effects
of DRSs on litter. Rather, it looks like a very good one for doing so, the more so since
the author upon whose work they rely has noted:
‘Litter is usually considered to be first and foremost a visual form of pollution
where the larger items are more visible to pedestrians and doubly so to
motorists. However, the primary problem with including the small items is
they bias the results towards the less visible components of litter.
52
It should also be noted that the US systems discussed were not achieving the same
return rates as many European systems. The effect on litter reduction might be
expected to be higher in systems where the return rates are higher.
Perchards go on to cite a statement from the same US author who uses, as
representative of the cost of removing one beverage container from litter through
DRSs, the cost of handling 164 containers through the DRS scheme. The author
notes
Note that this analysis is concerned only with litter reduction and ignores any
impacts such a program might have on waste reduction or materials and
energy conservation
One might have thought that given that something else was happening with 163
other containers (being collected and recycled), this approach to analysing the costs
of litter reduction might have been deemed completely and utterly inappropriate, yet
this is given as credible evidence that DRSs are an expensive form of litter reduction.
The same claim is made, incidentally, by INCPEN:
53
Recent work by Syrek in 2003 shows that under US conditions, deposits are
by far the most expensive way of eliminating an item of litter. He also points
out that unlike the 1970s, when a relatively large percentage of containers
ended up as litter, recent surveys show that even in non-deposit states less
than 0.3% of all containers now end up as litter.
This is not credible research. It is rather like assuming that the cost of a meal for
one person at a wedding are equal to the whole cost of the wedding meal, when
there are 163 other people at the same wedding
In jurisdictions such as Hawaii, where the prevalence of beverage containers in litter
has been a motivation for the introduction of a DRS, the problem also extends to
pollution of the marine environment. One report from the State of Hawaii shows how
beverage containers have changed in terms of their prevalence in litter (debris) over
time.
54
The data are shown in Table 4-2 and Table 4-3.
52
Steven Stein and Daniel Syrek (2005) New Jersey Litter Survey: 2004, A Baseline Survey of Litter at
94 Street and Highway Locations, Report for the New Jersey Clean Communities Council, January 28,
2005. http://www.njclean.org/2004-New-Jersey-Litter-Report.pdf
53
INCPEN (2008) Mandatory Deposits on Packaging,
http://www.incpen.org/pages/data/MANDATORY%20DEPOSITS%20May%202008.pdf
54
State Of Hawaii Department Of Health (2008) Pursuant To Sections 342g-102.5(H), 342g-114.5(B),
And 342g-123, Hawaii Revised Statutes, Requiring The Department Of Health To Give A Report On

29
Table 4-2: Counts of Debris Found During Cleanup in Hawaii since the Start of the
Deposit Refund Scheme in October 2002
Beverage Container
Type
2003 2004 2005 2006 2007
Glass Bottles 7,687
11,362
7,194
5,759
5,008
Plastic Bottles 5,246
5,215
3,824
4,799
2,965
Metal Cans 4,946
6,894
3,518
3,959
2,932
Total 17,879
23,471
14,430
14,517
10,905
Source: State Of Hawaii Department Of Health (2008) Pursuant To Sections 342g-102.5(H), 342g-
114.5(B), And 342g-123, Hawaii Revised Statutes, Requiring The Department Of Health To Give A
Report On The Activities Of The Deposit Beverage Container Program, Report To The Twenty-Fifth
Legislature State Of Hawaii 2009, November 2008
Table 4-3: Percentage of Total Debris Collected During Cleanup
Beverage Bottles & Cans 2003 2004 2005 2006 2007
Glass, Metal, & Plastic 15.9%
14.5%
12.3%
8.7%
6.7%
Source: State Of Hawaii Department Of Health (2008) Pursuant To Sections 342g-102.5(H), 342g-
114.5(B), And 342g-123, Hawaii Revised Statutes, Requiring The Department Of Health To Give A
Report On The Activities Of The Deposit Beverage Container Program, Report To The Twenty-Fifth
Legislature State Of Hawaii 2009, November 2008
The report notes:
While there appears to be a downward trend in the number of bottles and
cans found at beaches, beverage containers, along with associated caps and
lids, continue to be a large portion of beach litter. This is why it is important to
continue to place a deposit on beverage containers to decrease the
temptation to litter and increase the incentive to recycle.
An interesting feature of the Hawaii data is that it shows the problem is not simply
one of terrestrial litter. Indeed, beverage containers appear to be (relatively) more
problematic in underwater cleanups (see Table 4-4).
Regarding plastics in particular, a UNEP report notes the prevalence of plastic
bottles, caps and bags among the key forms of marine litter giving rise to
increasingly serious problems at sea. Evidently, in the marine environment, it is the
The Activities Of The Deposit Beverage Container Program, Report To The Twenty-Fifth Legislature
State Of Hawaii 2009, November 2008.

30
longevity and potential harm caused by plastics that makes them of particular
concern.
55
Table 4-4: Top Five Debris Items Collected During the 2007 Cleanup
Land Cleanups Only Number of
Debris Items
Percent of
Total
Collected
1. Cigarettes & Filters 72,053 44.7%
2. Caps & Lids 21,210 13.1%
3. Food Wrappers and Containers 16,554 10.3%
4. Beverage Containers (glass, metal, plastic) 10,505 6.5%
5. Cups, Plates, and Utensils 7,331 4.5%
Underwater Cleanups Only Number of
Debris Items
Percent of
Total
Collected
1. Fishing Line 1081 54%
2. Beverage Containers (glass, metal) 393 19.6%
3. Cigarettes, Filters, & Cigar Tips 248 12.3%
4. Food Wrappers and Containers 55 2.7%
5. Caps & Lids 39 1.9%
Source: State Of Hawaii Department Of Health (2008) Pursuant To Sections 342g-102.5(H), 342g-
114.5(B), And 342g-123, Hawaii Revised Statutes, Requiring The Department Of Health To Give A
Report On The Activities Of The Deposit Beverage Container Program, Report To The Twenty-Fifth
Legislature State Of Hawaii 2009, November 2008
A study undertaken in Australia suggested that deposit schemes were likely to be
the most effective policy option for reducing litter amongst those considered for
improving recycling:
56
55
Ljubomir Jeftic, Seba Sheavly, and Ellik Adler (2009) Marine Litter: A Global Challenge, Report for
UNEP, April 2009,
http://www.unep.org/regionalseas/marinelitter/publications/docs/Marine_Litter_A_Global_Challeng
e.pdf
56
BDA Group (2009) Beverage Container Investigation, Report for the EPHC beverage Container
Working Group, March 2009.

31
A national CDS [container deposit scheme] is expected to provide the
greatest reduction in overall litter levels, with the potential to provide a 6%
reduction in the total national litter count and a 19% reduction in the total
national litter volume.
Finally, there is another way in which removal of used beverage containers from
litter could contribute to cleaner streets. Given that beverage containers are
relatively voluminous items, their removal from litter bins would leave more room
for other waste. The CPRE’s Litterbugs report confirms that 91% of the public believe
that increasing the number of bins is the most effective way of reducing litter.
57
A
useful parallel approach might be to free up space in existing bins. The report cites
the New York bottle bill as reducing container litter by 70-80%. Clean-up costs, as
well as landfill costs, were reduced. The scheme enjoys solid public support (84% of
voters in 2004) and so has been extended in 2009 to cover non-carbonated drinks,
which make up 27% of beverage sales.
4.3 Implications for Transport
Perchards suggested that introducing a deposit scheme in Ireland would be
unfavourable from an environmental perspective, partly owing to the duplication in
logistics:
58
Deposit containers would be transported separately for recycling from other
packaging. That would mean additional trucks, with increased energy and
carbon impacts. One set of trucks would collect containers from retailers and
another would transport packaging waste collected from the existing bring
and kerbside system. Deposit containers would have to be kept separate
from other packaging. It may sometimes be possible to collect both together,
as deposit packs would have to be in sealed containers, but collection
contracts would be awarded separately for each stream, so this arrangement
would often not be possible.
This argument is unconvincing and shows little comprehension of the factors
affecting collection logistics. Currently, in Ireland, as in the UK, much of the
collection of dry recyclables makes use of kerbside collections. The removal of low
bulk density beverage containers (plastic and cans) from the collected waste stream
would have the effect of freeing up volume in containers, and on recycling vehicles,
improving the logistics for the collection of other materials using the existing
collection schemes.
Given:
¾ That the logistics of picking up relatively large quantities per pick-up from
specific collection points would be favourable under a deposit scheme;
57
A. Lewis, P. Turton and T. Sweetman (2009) Litterbugs: How to Deal with the Problem of Littering,
Report for CPRE, March 2009.
58
G. Bevington (2008) A Deposit and Refund Scheme in Ireland, Report commissioned by Repak Ltd.,
September 2008.
32
¾ The absence of a need for sorting at a dedicated sorting facility (with its own
energy demand); and
¾ The likely very low loss rates in the recycling process because of the pre-
segregated nature of the material,
then the argument made would appear to amount to pure speculation, based upon
an extraordinarily unlikely scenario in which there is no effect on the logistics of the
pre-existing system, even when low bulk density materials are removed from that
collection.
Furthermore, if the recovery of containers through a deposit scheme is very high,
arguably, there is limited need for a ‘duplicate’ scheme. Indeed, this closely
approximates to the Danish approach. A considerable part of the literature speaks
of the possible duplication in cost of running parallel schemes. The commentary
overlooks the point that when captures are very high from deposit schemes, then
there is very little duplication, and kerbside schemes can concentrate on optimising
the logistics of collecting the remaining materials, such as paper and card.
4.4 Summary View
The evidence suggests that DRSs are likely to increase the capture of the targeted
materials for recycling. This is unsurprising as the deposit gives the purchaser an
incentive to take the material back to an appropriate location in order to generate a
refund.
The captures achieved appear to be influenced by the level of the deposit applied.
This is in line with what is expected by economic theory.
The schemes also appear to influence the prevalence of litter. It is true that deposit
schemes do not affect littering of items such as cigarette butts or chewing gum,
both of which are prevalent in terms of counts, but the contribution of beverage
packaging to the volume of litter appears to be disproportionately large relative to
its prevalence as revealed in surveys based on counts. Hence, DRSs affect the
volume of litter in a manner which is disproportionate to the prevalence of beverage
packaging in litter as recorded through ‘counts’. There are good reasons to believe
that the volume of litter (not the ‘count’) is what gives rise to the associated
disamenity.
The suggestion that transport impacts are significantly worsened when DRSs are
introduced is not based upon detailed analysis. There is a requirement to
understand how the logistics of the DRS reduce the transport movements in the
kerbside scheme (for recyclables as well as refuse). Only when these effects are
understood can the net effect be quantified.

33
5.0 Methodology for Cost Benefit Analysis
In order to examine the potential costs and benefits associated with the introduction
of a DRS in the UK, the following key steps were employed:
1) Review of existing DRSs worldwide;
2) Formulation of high-level design of a DRS to be modelled for the UK (including
range of materials);
3) Establishment of baseline tonnages of waste collected at the kerbside, through
bring sites, as commercial waste, via on-the-go recycling and from street
sweepings, and also the total number of units placed on the market. In order to
maximise the potential impact of introducing a DRS, we have modelled a system
that covers the following beverage container materials:
59
A) Plastic bottles made from PET;
B) Metal cans, both steel and aluminium; and
C) Glass beverage containers.
The modelled system targets non-refillable containers, because the market for
refillables in the UK is much smaller than for non-refillables and there will
typically already be systems of collection for re-use of refillables e.g. glass milk
bottles.
60
4) Determination of tonnages that would be diverted from each of these waste
flows into the DRS in:
A) a complementary system; and
B) a parallel system.
5) Establishment of the costs and revenues for both the complementary and
parallel DRSs;
6) Determination of changes in costs relative to the baseline achieved by changing
the flow of deposit-bearing waste into kerbside collections, bring sites,
commercial waste stream, on-the-go recycling and street sweepings, and the
DRS;
7) Determination of key environmental impacts (benefits and disbenefits)
associated with complementary and parallel systems in relation to the baseline.
To include the disamenity associated with litter;
59
Few systems cover, for example, cartons such as tetrapak. One of the reasons for this relates to
the shape of the containers. Advances in reverse vending machine technology are expected to make
it possible to include beverage cartons in future schemes.
60
CRR (2009) Policy Study: Refillables – Evaluation of Market Opportunity in the UK, Centre for
Remanufacturing and Reuse, August 2009, available at
http://www.remanufacturing.org.uk/pdf/story/1p317.pdf?-
session=RemanSession:42F9475818a2d30D7AXwp1883067

34
8) Estimation of the impact of the scheme on the flows of revenues through the
Packaging Recovery Note/ Packaging Export Recovery Note (PRN/PERN)
system; and
9) Pulling all figures together to produce a cost benefit analysis for the introduction
of a DRS in the UK.
The key inputs and assumptions used for each of these steps are outlined in the
remainder of this section.
5.1 Summary of Existing Deposit Systems Worldwide
In order to determine the high-level configuration of the DRS model for the UK, we
were able to draw on a substantial amount of existing literature regarding current
DRSs in place worldwide. This literature included the following studies:
¾ BIO Intelligence Service (2005) Environmental- and Cost Efficiency of
Household Packaging Waste Collection Systems: Impact of a Deposit System
on an Existing Multimaterial Kerbside Selective Collection System, report
written for Apeal.
¾ ERM (2008) Review of Packaging Deposits System for the UK, Final Report
produced for Defra, December 2008.
¾ Ernst & Young (2009) Assessment of Results on the Reuse and Recycling of
Packaging in Europe, report produced for the French Agency for Environment
and Energy Management (ADEME), March 2009.
¾ Eunomia et al. (2009) International Review of Waste Management Policy:
Annexes to Main Report, Report for Department of the Environment, Heritage
and Local Government, Ireland, September 2009.
¾ EUROPEN (2007) Economic Instruments in Packaging and Packaging Waste
Policy, Brussels: EUROPEN.
¾ Oakdene Hollins (2004) Deposit Return Systems for Packaging: Applying
International Experience to the UK, report for Defra, December 2004
¾ Oakdene Hollins (2008) Refillable Glass Beverage Container Systems in the
UK, Report for WRAP, 26 June 2008.
¾ Perchards (2007) Study on Factual Implementation of a Nationwide Take-
back System in Germany After 1 May 2006, Final Report, 14 February 2007.
¾ Robert C. Anderson (2004) International Experience with Economic Incentives
for Protecting the Environment, Report for US EPA, Nov 2004;
¾ Covec Report (2008) Potential Impacts of the Waste Minimisation (Solids)
Bill: Update Report, Report for Packaging Council of New Zealand, May 2008,
http://www.pca.org.au/uploads/00548.pdf ;
¾ N. Tojo, T. Lindhqvist and G. Davis (2001) OECD Seminar on Extended
Producer Responsibility, EPR: Programme Implementation and Assessment,
Seminar for the OECD, December 2001

35
¾ RDC-Environment & Pira International (2003) Evaluation of costs and
benefits for the achievement of reuse and recycling targets for the different
packaging materials in the frame of the packaging and packaging waste
directive, Report for the European Commission, March 2003
¾ D. O’Connor (1996) Applying Economic Instruments in Developing Countries:
From Theory to Implementation, OECD Development Centre, May 1996
A summary of the international DRSs currently in place can be found in Appendix
A.1.0. From the literature available, and predominantly based on previous work
undertaken by Eunomia, we were looking to extract the key lessons learned from
existing systems in order to determine a preferred high-level model for the UK.
61
An
outline of the chosen system is given in Section 5.3.
5.2 Mass Flows – Baseline and Scenarios
The first step in the development of the quantitative model was to decide which
beverage containers could be covered by a deposit scheme.
The materials we have included in the DRS are one-way (non-refillable) beverage
containers. The following containers were considered to be relevant:
1) Plastic bottles made from PET eg. containers for fizzy drinks, mineral water,
squash. The recycling symbol on these products is:
2) Metal cans, both steel and aluminium eg. containers for fizzy soft drinks,
alcoholic beverages, energy drinks etc.
3) Glass beverage containers eg. beer bottles, wine bottles, soft drink bottles etc.
Although there is, strictly speaking, no reason why, in theory, other containers or
packaging could not be collected in these systems, the model has been designed
around beverage containers for the following key reasons:
¾ More investment in technology would be required in order to enable
recognition in reverse vending machines (RVMs)/counting centres for other
types and, importantly, shapes of containers/packaging.
¾ Beverage containers are more likely than other types of food-based
containers to be consumed away from home and thus end up as litter.
62
¾ Hygiene issues – particularly in association with plastic milk bottles, but also
for other food-based containers; hygiene issues associated with milk bottles
61
Eunomia et al. (2009) International Review of Waste Management Policy: Annexes to Main Report,
Report for Department of the Environment, Heritage and Local Government, Ireland, September
2009.
62
http://www.bottlebill.org/about/benefits/curbside.htm

36
have been stated as a reason for not including high-density polyethylene
(HDPE) in existing DRSs.
63
The modelled system targets non-refillable beverage containers, because the
market for refillables in the UK is much smaller than for non-refillables and there will
typically already be systems of collection for re-use of refillables, eg. glass milk
bottles.
64
For the purposes of this modelling, we have thus considered refillables as
‘exempt’ from the deposit scheme. If the system we are proposing were to be
implemented, then we would suggest that exemptions for refillables should be
supported only where return rates exceed a minimum level (probably in excess of
75%). This minimum return rate would ensure that any producers seeking to switch
to refillable beverage containers in order to circumvent the deposit scheme would
still need to meet relatively high return rates for these containers, and would thus
also contribute to the improvement in the management of beverage containers
across the UK. Focusing on non-refillables in the DRS will exploit the potential for
increased recycling rates, lead to an increase in the quality of material collected for
recycling through the deposit mechanism and reduce litter levels.
The second step in building the cost benefit analysis model was to consider the
current material flows in the UK, where the waste arises and how much of the waste
is sent for recycling compared to how much requires disposal. Figure 5-1 indicates
the possible material flows in our container universe (before the DRS).
In this study we have assumed the baseline year is around 2015; the landfill tax
escalator will have increased to £80 per tonne by 2014/15, and by this time, it is
also likely that fully comprehensive kerbside collection services will have been rolled
out to all households in the UK.
65
In order to provide direct comparison, the ensuing
changes to the baseline as a result of the introduction of a DRS have also been
modelled based on the same year.
Relevant data sources covering all of the elements shown in Figure 5-1 were used to
extract information relating to the containers we are considering. Many of the data
sources do not provide disaggregation down to the level required, so some
assumptions were required to break down material fractions into the following
elements:
¾ Glass Bottles ≤500 ml
¾ Glass Bottles >500 ml
¾ PET Bottles ≤500 ml
¾ PET Bottles >500 ml
63
ERM (2008) Review of Packaging Deposits System for the UK, Final Report produced for Defra,
December 2008.
64
CRR (2009) Policy Study: Refillables – Evaluation of Market Opportunity in the UK, Centre for
Remanufacturing and Reuse, August 2009, available at
http://www.remanufacturing.org.uk/pdf/story/1p317.pdf?-
session=RemanSession:42F9475818a2d30D7AXwp1883067
65
‘Fully comprehensive’ means a system that would collect all of the containers within the scope of
this study.

37
¾ Cans (Ferrous)
¾ Cans (Aluminium)
All the data sources and assumptions are set out in Appendix A.2.0.
Figure 5-1: Possible Container Material Flows (Pre-Deposit Refund System)
Source: Eunomia
The final step was to model the quantitative impacts of introducing a DRS. In order
to show some of the variation in the overall costs of the system in relation to
different potential configurations that might occur in the UK, two scenarios were
considered as follows:
Complementary – where no beverage containers are collected at the
kerbside ie. the DRS is complementary to the existing kerbside schemes;
and
Parallel – where the household kerbside systems for beverage containers
operate in parallel to the DRS.

38
Some general principles relating to each of the scenarios were considered. These
principles centred on the likely return rates that might be expected in the
complementary and parallel DRSs. The modelling then established what containers
would be left in the remaining current waste collection routes (kerbside collections,
bring sites/Household Waste Recycling Centres (HWRCs), commercial waste
collections, on-the-go recycling, street sweeping, left in the environment), and the
subsequent costs and benefits associated with both the DRS and other waste
collection routes. The approach taken was to calculate the change in material flows
that is brought about by the introduction of a DRS and, from this, to calculate the
change in cost (rather than building up the total costs of managing all beverage
containers in the UK both with, and without, a DRS). Nonetheless, for some
elements of the system, changes could only be calculated through understanding
absolute costs both before and after the introduction of the deposit scheme, and
then subtracting the one from the other (eg. kerbside collection costs). The
assumptions relating to the mass flows in the system are fully considered in
Appendix A.2.2.
5.3 UK Deposit Refund System Model
The various stakeholders involved in operating a DRS are likely to include:
¾ A government body authorising the system and associated finances, and
setting recycling targets for the various materials;
¾ A central organisation owned and run (within the constraints set by the
authorising body) by, for example, non-governmental organisations (NGOs),
industry bodies, producers, breweries and retailers;
¾ The manufacturers of containers, producers and importers of beverages and
industries that ‘fill’ the containers;
¾ Any retailers which sell beverages in the UK;
¾ All consumers which purchase beverages in the UK; and
¾ Businesses and organisations involved with the collection, sorting and
reprocessing of waste containers.
Within the DRS, various stakeholders are involved in the material flows of beverages
(pre and post-consumption), deposit payments, other finances and sales or
container return data. An overview of the key elements, material and finance flows,
in the UK’s DRS model developed for this study is given in Figure 5-2.

39
Figure 5-2: Deposit Refund Model
Source: Eunomia

40
The system developed for this study is based on similar principles to the systems
which exist in Denmark (Dansk Retursystem) and other Scandinavian countries
(Norsk Resirk, Returpack and Palpa), and in a number of provinces within Canada
(ENCORP Atlantic Ltd, ENCORP Pacific Inc), although the details reflect the UK’s
structure of retailing. The operation of the system is outlined in the following points:
¾ As beverages are produced and sold to wholesalers, or directly to retailers,
producers send sales data to a central system along with a payment
matching the total value of the deposits on all items sold. The cost of the
deposits is then paid back to the producers, by wholesalers or retailers, upon
sale. The same happens as wholesalers sell items to retailers. Producers also
pay an administration fee to cover the remaining costs of the system. This is
set each year to reflect market prices of recyclate, amongst other factors;
¾ When the consumer purchases a beverage they pay the deposit to the
retailer, so the retailers are also reimbursed the total value of deposits;
¾ As consumers return empty containers to stores or other take-back centres,
the deposit is paid to them by the retailer. This puts the retailer out of pocket,
so the retailer then sends the returns data to the central system, which then
reimburses the retailer for those returned containers for which a deposit has
been paid out to the consumer. Thus the circle of deposit payments is closed.
As the return rate for containers is not 100%, the unclaimed deposits result
in revenue being retained by the system, which can be used to fund its
operation.
¾ In addition to the deposit, the central system pays a handling fee to the
retailer for each returned container, the intention being to compensate the
retailer for loss of space (storage requirements) and time (in processing the
deposit and taking back the containers). Handling fees are reviewed and
adjusted each year;
¾ Returned empty containers are collected in a number of ways. Automated
systems of collection use reverse vending machines or automated counting
machines. Manual collection is also possible. in this instance the retailer
accepts the container, over the counter, and stores it in bags or crates within
the store/outlet for transport;
66
¾ Where the containers are collected via an automated machine, the sorted
(and predominantly compacted) material can be transported directly to a
recycler, with material revenues being paid back into the central system.
66
This differs to the typical systems employed in countries such as Sweden and Canada, where
collections occur at a small number of redemption centres rather than at every retail outlet. We
believe that in order to maximize return rates and to remove the need for consumers to travel
individually make their way to redemption centres to return their containers, a denser network of
collection points would be more appropriate for the UK, and would eliminate additional
environmental impacts which might arise from making ‘dedicated journeys’ to redemption centres.
Thus we have modeled the system based on a higher number of collection points via both automated
and manual methods of collection, similar to systems used in Norway and Denmark.

41
Material revenues will also be paid on those containers that are collected
manually, though this material will first have to be transported to a dedicated
centre for counting, sorting and compacting, before it can be hauled on to a
recycling facility. These costs are met by the central system;
¾ The central system is the focal point for the flow of information regarding
container sales and finance for the whole DRS. A significant one-off cost will
be required to initially set up the DRS, including all the necessary
administrative support, which we have modeled as being met by ‘one-off’
producer and retailer joining fees. There will also be on-going costs
associated with administering the system which are covered as part of the
producer administration fee paid on each unit that is placed on the market.
The overall administration fee payable by the producers/ importers is
calculated as the balance of income from material revenues and unclaimed
deposits against the costs of collection, transport, processing, admin and
handling fees. In other words, the administration fee guarantees the DRS is
‘cost neutral’ overall.
It is worth noting that the system modeled here differs to that which exists in
Germany, where the organisation that manages the deposit refund scheme, the
DPG, only has an ‘over-seeing’ capacity. The system in Germany is much less
centralised, with retailers able to set up their own systems of collection and
processing, and payments moving directly between the producer and retailer, rather
than going through a central system.
67
Given the array of problems that have been
highlighted in association with the German system, that this system has been
recognised as an expensive scheme and that the scheme was originally partly set up
to try to encourage the refillables market, we chose to model a central system for
the UK and learnt from the issues that have occurred in the German system.
68,69
It is also worth noting the recent communication from the European Commission,
which states several safeguards that need to be respected in relation to how a DRS
should be designed in order to ensure a fair, open and transparent system,
including:
1) A countrywide system (which could be run either via a non-government
organisation (NGO), a government body or via the producers/distributors
concerned, and which may consist of more than one system operator so long as
the systems are compatible with each other). This will:
A) Ensure a sufficient number of return points for consumers to encourage
participation in the system.
67
Ernst & Young (2009) Assessment of Results on the Reuse and Recycling of Packaging in Europe,
report produced for the French Agency for Environment and Energy Management (ADEME), March
2009.
68
Perchards (2007) Study on Factual Implementation of a Nationwide Take-back System in
Germany After 1 May 2006, Final Report, 14 February 2007.
69
G. Bevington (2008) A Deposit and Refund Scheme in Ireland, Report commissioned by Repak
Ltd., September 2008.

42
B) Avoid ‘island solutions’ – a retailer-owned patchwork of different return
systems which are not compatible and which often force additional costs on
suppliers to adapt packaging to the requirements of the specific retailer.
2) A system which is open to all economic participators in the sector concerned –
including imported products under non-discriminatory conditions. This will avoid
creating an unjustified barrier to trade or distorting competition.
3) A system which ensures that there is no discrimination between those products
that are exempt and those that are subject to a deposit and that any
differentiation is based on objective criteria, ie. in principle, focus on material
and not on content of beverages as it is the former which drives the
environmental performance of the system.
Point 1 is addressed by the use of a central system approach to the UK deposit
refund model, as discussed above. In addition, we have modeled the UK system as
requiring a collection point at almost all retail outlets that sell beverage containers,
in order to ensure a sufficient number of return points for consumers and to remove
the need for consumers to travel individually to redemption centres to return
containers. In order to give the retailer a choice in how returned containers are
subsequently collected, and to make the return easier for larger stores to which
most containers would be likely to be returned, we have also modeled each retail
outlet as either using an automated system of collection (eg. reverse vending
machine or automated counting centre) or a manual collection, where the retailer
takes back the container over the counter and stores the containers in bags/crates
within, or at the front of the store/outlet for onward transport. This approach is
similar to the collections offered in countries such as Norway and Denmark.
In addressing Point 2 and Point 3, we have included all non-refillable beverage
containers placed on the UK market by both domestic and international producers in
our modelling, and have targeted beverage containers according to material (see
Section 5.2).
Finally, it should also be noted that the material revenues used in the DRS varied
from those used in the kerbside collection system. Given the higher quality material
that can be collected in the DRS and the greater amount of material that will be
handled by one central system, the values used for PET, steel and aluminium
collected through this system are higher than those collected at the kerbside.
70
On
the other hand, we have assumed that the value of glass will be the same,
irrespective of whether collected via a deposit scheme or at the kerbside. This is
highly favourable to the kerbside schemes, recognising that many commingled
systems will not produce glass of a quality suitable for re-melt. Details of the
material revenues used in the modelling can be found in Appendix
A.3.4.
One of the crucial elements in the deposit model is the setting of the deposit itself.
The overall deposit rates modelled are given in Table 5-1, based on achieving a 90%
return rate.
70
Both sets of values are based on a combination of Letsrecycle figures
(http://www.letsrecycle.com/
) and our own market knowledge.

43
Table 5-1: Proposed Deposits for Containers in UK Deposit Refund System
Container size
% of UK market
Deposit
≤ 500ml
65%
£0.15
> 500ml
35%
£0.30
Overall
£0.20
The choice to model two deposit rates for different container sizes was based on the
majority of existing deposit schemes worldwide. The choice of deposit was
calculated in two key stages. Firstly, the return rate was plotted as a function of the
deposit across existing schemes (see Figure 5-3), in order to establish what deposit
would be required to reach a 90% deposit rate. The deposits were converted from
the local currency of the DRS to GB Pounds (GBP) using OECD Purchasing Power
Parities (PPP) from 2008 to give a better estimate of the value of the deposit than
simply using the current exchange rate.
71
Figure 5-3 illustrates that, in order to
achieve a return rate of 90%, the deposit should be set at around 20p per container.
Secondly, UK market research shows that approximately 65% of potential deposit
refund containers sold have volumes less than or equal to 500ml, while 35% have
volumes greater than 500ml.
72
Using this split, we set the deposit at 15p for small
containers and 30p for large containers.
In respect of the relationship between deposits and return rates, Perchards
questioned Oakdene Hollins’ assumption regarding return rates:
OH [Oakdene Hollins] claim that “international experience shows that a
deposit of 5p per container should result in a 70% return rate.” They do not
explain why a 12p deposit on refillable containers in the UK 25 years ago
produced a return rate which was of the same order of magnitude.
There is a big difference in the return rates achieved when sales are typically
made by the crate – for beer or bottled waters, in countries where there is
strong product loyalty often associated with local manufacture. Sales by the
crate have never been the custom in the UK, where supermarkets did not
stock soft drinks or beer until the advent of non-refillable bottles and cans
and changes in the licensing laws.
If what is being claimed is that the only jurisdictions which achieve high return rates
are those where the majority of sales are in crates, then this is not true. Our
approach assumes that the principle motivation driving returns is an economic one.
71
OECD (2010) Purchasing Power Parities (PPP), Accessed May 2010,
http://www.oecd.org/department/0,3355,en_2649_34357_1_1_1_1_1,00.html
72
Personal communication with Canadean®, May 2010, http://www.canadean.com/

44
Figure 5-3: Return Rates as a Function of Deposits in PPP-Adjusted GB Pounds.
y = 0.0529Ln(x) + 0.9876
40%
50%
60%
70%
80%
90%
100%
110%
0.00 0.05 0.10 0.15 0.20 0.25 0.30
Deposit in PPP adjusted GBP
Return Rate
Denmark Norway Finland USA Israel Australia Log. (All)
Source: Eunomia
Elsewhere, Perchards note:
Swedish law mandates a 90% return rate for aluminium beverage cans but
the deposit set by the Swedish deposit system is only 50 öre (3p). The return
rate each year is stable and 85% was achieved in 2003. This suggests that,
although the level of the deposit can affect the return rate achieved, other
factors are also significant, for instance
• the habit of return not being lost
• ease of return and maybe consumer incentives (reverse vending
machines)
• buying by the crate rather than buying individual bottles, so there is
one single high-value transaction.
It is reasonable to assume that other factors will play a role in determining levels of
take back, notably the ease of return, but it is unreasonable to suggest that the
magnitude of the incentive is of limited relative significance. It is also not
reasonable to assume that a ‘habit of return’ cannot be re-established once lost.
Such ‘habits’ have to be established in order to be, subsequently, lost, and their
establishment and demise tends to track the existence or otherwise of DRSs. The

45
Swedish economist, Thomas Sterner, made interesting observations of this nature.
Regarding aluminium cans, he notes:
73
Recycling rates have passed 90 percent and it appears that the increase in
nominal deposits from 25 to 50 ore in 1987 has played a role. The fact that
the real value of deposits has fallen since then does no, however, seem to
have reduced collection. Maybe there have been changes in attitude and
information or ease of deposition. [….] Perhaps deposits are important just as
signals to change behaviour, which then has its own inertia.
Regarding wine and liquor bottles, in the same country (Sweden), he notes:
The nominal deposits rose from just 15 ore to 2.00 SSEK/bottle. In real
terms, the increase has been more than 100 percent since 1970. It appears
that the recycling rate goes up each time the nominal deposit rises.
This highlights the fact that the way people respond to deposits is likely to be
complex, but there seems little reason to believe there will be no price effect. There
appears, in any case, to be no basis for an assumption that a ‘habit’ cannot,
therefore, be established anew. The system we have proposed makes returns
convenient so should support such habit reformation. These habits do not exist
independently of DRSs, but rather, the DRSs tend to generate them (and as Sterner
suggests, these habits may be characterised by some ‘inertia’).
Other key elements involved in modelling the DRS include determination of the
handling fee payable to the retailers. This is based on acquiring an understanding of
the retail landscape across the UK, the likely proportion of retailers that would use
automated machines compared to manual take-back, the cost to the retailers of the
take-back process, and the costs of transport, containers and counting centres
required to deliver the collected containers for re-processing. In addition, the on-
going administrative costs associated with running the central system were
determined, as were the one-off costs associated with initial set up of the system.
It is important to note that the DRS in the UK will be different from those in other
countries because:
a) There are very few DRSs left operating in the UK (especially for alcoholic
beverages, beer bottles etc), so most containers are one-way and will be eligible
for inclusion in the system;
b) Modern behavioural attitudes appear to place a premium on waste collection
activities which make minimal demands on personal time - thus drop-off ought
to be quick and locations easily accessible;
c) There is a relatively high population density; and
d) The historic nature of retail outlets has led to a structure which is essentially
characterised by large numbers of small outlets operating in a decentralised
73
Thomas Sterner (1999) Waste Management and Recycling, in T. Sterner (ed.) (1999) The Market
and the Environment: the Effectiveness of Market-based Policy Instruments for Environmental
Reform, Cheltenham: Edward Elgar
46
manner (clearly many have now been replaced by larger supermarkets, but a
considerable number remain).
All of these points mean that the system must have the ability to collect 1) large
quantities of glass, especially from pubs and bars; 2) a high proportion of containers
from a large number of dispersed outlets, and on a frequent basis; and 3) ensure
that take back is possible through easily accessible locations, with minimal take
back time.
Following establishment of the retail landscape, the handling fee was calculated by
ensuring the following elements were included in the cost calculations:
¾ RVMs (reverse vending machines);
¾ Retail Space Infringements;
¾ Labour;
• Pickup / Unloading;
• Take Back;
¾ Transport;
¾ Counting; and
¾ Containers.
Figure 5-4 summarises the key components modelled in the DRS in the UK. Full
details of the step-by-step assumptions used in relation to the development of the
DRS are described in Appendix A.3.0.
5.4 Cost Reduction in Existing Waste Collection Systems
One of the key elements missing in the majority of existing studies on DRSs (see
Section 5.1) is the reduction in costs associated with fewer containers having to be
collected through all the routes set out in Figure 5-4. Even where this reduction has
been modelled in previous studies, it has been modelled rather poorly. This oversight
will result in an over-statement of the potential cost to society associated with the
introduction of a deposit refund scheme. Therefore, one of the key components of
this study was the inclusion of all relevant costs, most importantly the change in
costs from household kerbside collection systems.
Eunomia’s proprietary waste collection model, Hermes, has been used to investigate
the effect of implementing a DRS in the UK on kerbside collection schemes. Hermes
is a sophisticated spreadsheet-based tool that allows a wide range of local authority
specific and collection scheme specific variables to be modelled. The optimisation of
these variables allows us to build scenarios to reflect local circumstances accurately.
The main outputs of the model are recycling performance and cost.
Eunomia is confident that Hermes is as reliable a tool as any of its kind. It has been
used to model systems for authorities that collectively manage around 25% of the
UK’s total municipal waste. It is used to support contract procurement advice and
contract dispute resolution by building ‘shadow’ bids against which contractors’
tender submissions can be tested. Hermes has also been used in the context of
studies of relevance to national policy, and to undertake a cost benefit analysis for

47
the kerbside collection of food waste across the UK.
74
See Appendix A.2.0 for more
details.
Costs for all the other services that would be impacted by the introduction of a DRS
were also modelled. Appendix A.4.0 provides full details for each of the following
cost elements:
¾ Collection of containers through bring sites;
¾ Collection of containers through Household Waste Recycling Centres
(HWRCs) – both recycling and disposal;
¾ Commercial waste recycling / refuse collection; and
¾ Collection of containers from on-street litter bins and through street
sweeping.
Finally, it is worth considering the implications of a DRS for the existing policy
regarding packaging recycling. The UK’s Producer Responsibility (PR) scheme is
based upon a system of tradable compliance credits. The value of these credits
drops when the supply of the compliance credits far exceeds demand. For example,
targets for paper and card recycling are easily met at present, so the value of
Packaging Recovery Notes (PRNs) for paper and wood are around £2 per tonne. The
materials for which the level of performance is closer to what is required by the
targets are those which would be covered by a DRS (plastics, glass, steel and
aluminium).
74
Eunomia (2007) Dealing with Food Waste in the UK, report for WRAP, March 2007

48
Figure 5-4: Key Components Modelled in the Deposit Refund System in the UK

49
It would be expected, therefore, that the deposit scheme would reduce the price of
PRNs against counterfactual levels. It is difficult to know what this price reduction
might be. The value of PRN and PERN sales in past years has been as high as £100
million, though it has more commonly been of the order of £50 million (see Table
5-2). It seems not unreasonable to imagine that industry would see the cost of PRNs
fall by something in the order of £30 million as a result of the DRS, owing to the
increase in recycling. This seems particularly likely as the Government considers
increased packaging recycling targets.
75
If targets were not to increase so significantly, it might be that the DRS could lead to
a diminished need for the existing PRN mechanism. The key material would
probably be plastics, for which the potential for significant increases in packaging
recycling relates to a range of materials, of which the beverage container is only
one. Disbanding the existing policy might have significant benefits for companies in
terms of the efforts they make to demonstrate compliance. It would also eliminate
the costs of administering the policy at the UK level. These cost reductions may be
significant for companies across the UK, and for the public sector.
It should be noted that similar points were made by Oakdene Hollins in their work
for Defra, where there is discussion of the DRS overwhelming the existing PRN
system. Perchards, though, were critical of Oakdene Hollins’ assessment of the
effect of a DRS on the (then) existing UK packaging system, in particular on the price
of PRNs. We find the Perchards comments demonstrative of a lack of understanding
of the workings of the existing market mechanism. The following paragraph
highlights the extent of the confused views held by the reviewers:
PRNs are a market-based instrument. We think that much more thought is
needed to the impact on the PRN mechanism of a legally mandated DRS,
which is a command-and-control mechanism. One of the objectives of the
PRN system is to provide funding for collection, the idea being that PRN
revenues will allocate this efficiently. A deposit system would interfere with
this – its expense would make it unlikely to survive the competition with
cheaper collection systems in the PRN system. PRNs would need to be
revised to take account of it.
Quite what this means, perhaps only the authors know. However, most
commentators, including the OECD, for example, would argue that a DRS is no more
‘command and control’ than the PRN mechanism, driven, as that is, by the year to
year setting of recycling targets (which then influence the price of the PRNs). The
argument that a DRS would not survive because of its expense is to make light of
the fact that at the end of life, a consumer would have the option of either placing
the material in a kerbside container and receiving no deposit, or returning the
material to a vendor and recouping the deposit. It seems reasonable to assume that
if returns are convenient, consumers will choose the latter route.
75
Defra (2010) Implementing the Packaging Strategy: Recovery and Recycling Targets, Funding
Transparency and Technical Changes: A Consultation on Proposed Changes to the Producer
Responsibility Obligations (Packaging Waste) Regulations 2007 (as amended), March 2010.
50
In concluding, they state:
A more thorough discussion is needed of the possible interplay between a
DRS and the existing PRN system. We found it hard to understand how OH
concluded that PRN prices for the materials handled through a DRS would fall
to zero. The pack types that they recommend should be handled through a
DRS (plastic bottles, alu cans and possible some glass) represent only a
proportion of the packaging of those materials. The PRN system is a market
mechanism which, in our view, would need to be adapted if a DRS for
selected non-refillable containers were introduced.
This exhibits a complete lack of appreciation of the fact that the value of PRNs
reflects the imbalance, at the margin, of the supply of PRNs and the demand on the
part of obligated companies / compliance schemes for this evidence. If the
additional material collected by a DRS implies that packaging recycling targets in a
given year will be easily exceeded, then the value of PRNs would indeed fall close to
zero, just as it did in 2003 when the Government opted not to increase targets from
2002 levels. The point here is that the market for PRNs is tightest for the same
materials typically targeted by a DRS.
5.5 Environmental Impacts
Environmental impacts associated with the introduction of a DRS will occur from the
following processes:
1) Changes in the recycling of beverage containers;
2) Changes in the disposal of beverage containers; and
3) Changes in emissions associated with the collection and transportation of
containers to recyclers.
Regarding environmental benefits associated with diverting beverage container
waste from disposal, it should be noted that we have assumed 25% of the UK’s
waste will be managed though thermal facilities in the future, with the remainder
going to landfill (see Appendix
A.5.1.4). This is particularly important in the context
of PET, as avoidance of the disposal of plastics via thermal treatment would lead to
a significant reduction in greenhouse gas (GHG) emissions, whereas avoidance of
the disposal of plastics via landfill would have little overall impact on emissions.
The two main elements considered in modelling the environmental impacts
associated with the collection, recycling and disposal of beverage containers were a)
GHG emissions and b) air quality impacts. The approach to valuing these two
components is set out in Appendix A.5.0.

51
Table 5-2: Expenditure on PRNs and PERNs, 1999 - 2005
1999 - 2001 2003 2004 2005
PRN PERN PRN PERN PRN PERN PRN PERN
Paper £69,400,000 £3,900,000 £22,245,337
£1,744,263
£12,915,351 £3,938,957 £17,373,786 £12,447,897
Compost £4,889
Glass £16,600,000 £700,000 £8,223,179 £959,118 £10,600,571 £2,561,816 £15,642,454 £5,997,046
Steel £10,500,000 £4,400,000 £1,229,585 £1,245,237
£2,460,142 £2,181,782 £9,006,337 £18,631,570
Aluminium £800,000 £100,000 £432,628 £61,052 £779,113 £759,497 £1,859,214 £1,224,424
Plastics £15,100,000 £2,700,000 £1,634,515 £615,845 £1,792,668 £1,755,251 £6,960,361 £8,866,465
Wood £8,600,000 £5,322,252 £0 £5,254,424 £8,391,940 £0
Recovery
Clinical £7,855 £5,529
EfW £2,168 £7,897
EFW (MSW) £5,352,903 £480,622
RDF £102,663 £72,382
Recovery Total £5,465,589 £566,430 £677,973
Totals £121,000,000
£12,000,000
£44,553,085
£4,625,515
£34,368,699 £11,197,303 £59,916,954 £47,167,402
PRN + PPERN £133,000,000
£49,178,600
£45,566,002 £107,084,356
Source: Defra

52
Furthermore, there is a negative environmental impact, or disamenity, associated
with uncollected litter. A study by Cambridge Economic Associates indicates that the
average household would be willing to pay £25 per annum to live in a
neighbourhood where the streets are kept clean.
76
Unfortunately, however, this
value does not cover the potential willingness to pay to remove litter from rural
areas, and, as far as we are aware, there are no studies attempting to place a value
on the disamenity experienced in such circumstances in the UK.
The only significant study of this nature of which we are aware was carried out in
Australia by Pricewaterhouse Coopers. This indicated that households are willing to
pay, on average, AUS $4.15 per 1% reduction in litter. The quantification of
‘reduction’ is not clear, but if, in line with the work of Stein and Syrek, we take the
view that size (volume) is a proxy for visual impact, and that visual impact is what
residents most notice, then we might assume that households interpreted this in
terms of volume reduction.
77
Assuming this to be the case, then if one also assumes:
• Beverage cans occupying 25% by volume of litter (which may be
conservative);
78
and
• 80% reduction in beverage-related litter as a result of a DRS
79
then the effective reduction in litter volume would be equivalent to 20% of the total.
Using the Pricewaterhouse Coopers figures, converted to UK exchange rates (we
have used the rate UK£ 1 = AUS $1.73), the value of this would be £48 per
household.
This gives a net figure, across 26 million households in the UK, of £1,248 million per
annum.
5.6 Cost Benefit Analysis
The principle objective of the cost benefit analysis was to identify the net cost or
benefit to society from the introduction of a DRS in the UK. Conventionally, this net
cost or benefit is represented as follows:
76
Cambridge Economic Associates et al (2010) Developmental Work to Value the Impact of
Regeneration, Technical Report: Environmental Quality and Amenity, May 2010
77
Steven Stein and Daniel Syrek (2005) New Jersey Litter Survey: 2004, A Baseline Survey of Litter at
94 Street and Highway Locations, Report for the New Jersey Clean Communities Council, January 28,
2005. http://www.njclean.org/2004-New-Jersey-Litter-Report.pdf
78
The analysis in Section 4.2 above suggests that the effect of DRSs on the volume reduction in litter
in the US may be well above this figure, and in systems which are achieving lower return rates than
the one modelled here. In addition, the analysis of the composition of litter in the UK is at least
suggestive of a relatively high proportion of the volume being occupied by beverage containers.
79
These figures are typical of the levels of reduction reported under DRSs for beverage containers
(see, for example, Perchards (2005) Deposit Return Systems for Packaging Applying International
Experience to the UK, Peer Review of a Study by Oakdene Hollins Ltd., Report to Defra 14 March
2005).

53
In this study, the environmental costs comprise the impacts of GHG emissions and
other air emissions, expressed in monetary terms. The main sources of
environmental impacts are given in the previous section.
In conventional cost-benefit analysis, the approach taken would be to strip out taxes
and subsidies from Government and to cost all environmental impacts. This
approach ensures that double counting is avoided. One of the reasons (though not
the only one) for doing this is that if the analysis includes both the financial costs,
inclusive of taxes and subsidies, and the environmental impacts of dealing with
waste, there is a risk of double counting where the taxes and subsidies are
themselves designed to reflect environmental impacts.
In practice, however, this tends to lead to figures which are unfamiliar to those
engaged in the industry, and which do not reflect the incentives which they face
within the market place. The most obvious example, perhaps, is with landfilling.
Here, the tax stands at £48 per tonne, rising to £80 per tonne by 2014/15. The
impacts of landfilling cans, however, are not expected to be anywhere close to £80
per tonne (the principal externalities of landfill relate to methane generation, and
cans do not biodegrade in landfills). However, actors in the market still need to pay
the tax.
In our approach, therefore, so as to ensure that the financial figures represent the
actual costs to operators, but recognising also the potential for double counting, the
approach we have taken is:
1. To model costs as they would be ‘in the market’
2. To include in the environmental analysis only those impacts which are either
a. not covered by existing policies or
b. addressed by policies, but where the impact exceeds the level of
internalisation implied by the policies which are in place (we have
included only the element of the environmental impact that is not
internalised by the policy).
This approach has the merit of reflecting ‘actual costs’ in the market, but also
ensures there is no double counting of the environmental impacts associated with
different ways of managing waste (which would occur if the impacts under 2b were
considered even where impacts are already internalised in market prices by policy).
In this study, we have attempted to build as comprehensive a model as possible in
terms of covering all the costs and benefits associated with the collection and
management of wastes. These include capital costs, operating costs, labour costs,
opportunity cost of lost retail or storage space, disposal costs, material revenues
and deposits unclaimed or ‘lost’ by the consumer. Full details of each stage of the
modelling, including a detailed methodology, data sources, and individual cost
elements are presented in Appendix A.2.0 to Appendix A.5.0. Figure 5-5 provides a
Cost or Benefit = Financial Costs + Environmental Costs

54
summary of the key elements that have been considered in calculating the overall
cost or benefit of introducing a DRS in the UK.
Figure 5-5: Cost Benefit Analysis Model - Overview
Source: Eunomia
6.0 Results from Cost Benefit Analysis
Following the methodology described in the previous section, the overall costs and
benefits associated with the introduction of a DRS in the UK have been calculated,
the results of which are presented in this section. As noted before, this will form the
basis of answering the research question:
‘How do the benefits of introducing a UK-wide DRS for certain beverage
container packaging compare with the costs of implementation and
operation?’
The costs in this analysis have all been measured relative to a baseline. This
baseline encompasses a situation from 2015 onwards, where full kerbside
collection services have been rolled out to all households in the UK. The overall costs
therefore represent a change to rather than an absolute cost of service provision.
However, the costs associated with the DRS will represent the annualised running
costs of the system, as there is no such system operating in the baseline.
To explain how the total costs for each scenario are derived, the DRS costs will be
described first, followed by the additional financial impacts, the monetised
environmental costs, and finally, the sum of these elements. The costs and benefits
associated with the complementary DRS will be described first, followed by the key
differences between this system and the parallel DRS. Some of the key factors
affecting the results are then considered in a series of sensitivity analyses.
6.1 Complementary System
The complementary system is one where the DRS complements rather than
competes against existing household collection services. This is enacted by changing
the service specification of the existing kerbside systems in such a way that the

55
householder is obliged not to place the relevant beverage containers in their
recycling box, bag or bin. Note that because the system might still collect glass jars,
metal food cans or other plastic packaging, the “mis-use” of this system would not
compromise the recycling system. Indeed, operators would have an incentive to
ensure that deposit container “contaminants” are segregated from the remainder of
the material so as to obtain the deposit revenues from them, though the nature of
the collection scheme might determine how straightforward or difficult this might
be.
Under this scenario, therefore, all beverage container waste being collected from
household recycling services is eliminated from the model. It is, however, assumed
that 5% of containers still end up in household refuse, as some people will not
change their behaviour patterns as a consequence of paying the deposit and will
deem the additional effort required to return any containers too significant. A small
decrease has also been modelled in the change in management of containers
though other routes, so that the overall return rate of containers in the DRS is
calculated as 90% (see Appendix A.4.0). This return rate is based upon the value of
the deposit placed on the container and similar return rates from other countries
(see Appendix A.3.1).
The share of annual costs and revenues involved in the operation of the DRS are
shown in Figure 6-1. The administration fee payable by the producer for each unit
placed on the market is calculated in order to bridge the outstanding imbalance
between the costs and revenues in the central system. Hence the overall system is
one in which all ‘net costs’ are recovered ie. the system costs equal the system
revenues.
Figure 6-1 shows the overall proportions of revenues and costs in the system. It does
not, however, provide any indication of who would be paying for which element. As
such, Figure 6-2 illustrates the flows of money throughout the DRS for each of the
key stakeholders. It is important to note that throughout this cost benefit analysis,
and in the sensitivity analysis that follows, a positive figure represents a ‘benefit’
and a negative figure represents a ‘cost’ to the stakeholder in question or for the
overall system.
The key points to draw from
Figure 6-2 are:
¾ Handling costs for the retailers are estimated to be around £576 million per
annum. We have modelled that these costs would be compensated by the
central system through a per unit administration fee of 4p for retailers with
Reverse Vending Machines (RVMs), and 1p for those without. Collection and
counting costs, financed by the central system, are likely to be around £337
million per year. Hence the retailers are compensated for all their costs, so
the net cost to them is zero;
¾ The consumers who do not, or cannot, return the containers they purchase
will lose the deposits they have paid – this is signified by the grey box in
Figure 6-2. At an overall 90% return rate, consumers would forfeit a total of
£491 million of unclaimed deposits. In our model, this revenue helps fund
the operation of the system. For this reason, it is important to have
complementary targets in place to ensure that the system is not designed so
as to ‘deliberately underperform’, and enable full funding through unclaimed

56
deposits. With targets in place, the system would likely be designed with a
deposit set at a rate designed to deliver the desired performance level,
consistent with the level of infrastructure provision. The provision of many
easily-reached return points should minimise the level of unclaimed deposits
as long as the deposit it set at a reasonable level.
Figure 6-1: Revenues and Costs in Operation of Deposit Refund System –
Complementary Scenario
¾ The outstanding imbalance between the costs and revenues (including
unclaimed deposits) in the central system of around £212 million are
recovered through the producer administration fees. The handling fee

57
payments to the retailers and the administration costs of the central system
are offset by the revenue generated from producer administration fees,
income from material sales and unclaimed deposits;
¾ The producer administration fee equates to around 0.7p per container placed
on the market; given that the producer will be likely to pass at least some of
this cost onto the consumer, this fee could be described as the ‘cost’ to
society of implementing the DRS. However, even if the producers decided to
pass 100% of this cost through to the consumer there would probably be very
little change in terms of volume of sales given that the additional cost per
unit is relatively low;
¾ The system implies a net cost to the producers i.e. producers are effectively
paying for the collection of beverage containers that they place on the
market.
The costs of the system are thus born by those who are responsible for the
generation of the waste – the producer and the consumer.
Figure 6-2: Cash Flows in the Deposit Refund System – Complementary Scenario,
£millions 2010 Real Terms
Pay deposit for
each sold container
= £5,257M
Purchase beverages:
pay deposit = £5,257M
Purchase beverages:
pay deposit = £5,257M
Pay deposit for
returned cans
= £4,766M
(Retailer cost – space and
labour in handling deposit-
bearing containers = £576M)
Income from material sales
= £210M
(Includes cost of administering
system, collection and transport
logistics = £337M)
+ Revenues from lost
deposits (= £491M)
Pay admin fee
per container
= £212M
Pay deposit to retailer for each
returned container = £4,766M
Pay handling fee
to retailer = £576M
Balance
= £zero
Balance
= £zero
Balance
= -£212M
Balance
= -£491M
Note positive figures imply savings
The shift in the management of beverage containers from the baseline situation to
the complementary scenario results in a reduction in the requirement to collect
waste from a number of routes. A material reduction in the amount of waste
requiring collection will thus lead to a change in the overall costs of service provision
for each of these routes. Table 6-1 shows the financial savings that accrue from the
introduction of the DRS under the complementary scenario.

58
It is clear from Table 6-1 that local authorities would save a significant amount of
money on their annual waste collection costs as a result of the introduction of a
DRS. In effect, the burden of waste management shifts from the ‘taxpayer’ to the
individual person (consumer), and the industry (producer/ importer) that is
responsible for generating the waste beverage containers. Thus, the ‘polluter pays’
principle is reinforced by the introduction of the deposit refund policy. Commercial
enterprises that are currently responsible for managing their employees’ wastes
should also see some financial benefit. The reduction in costs of administering the
PRN system also provides significant savings to businesses.
Table 6-1: Financial Savings from Existing Waste Collection Activities, £millions
Service
Local
Authority/
Taxpayer
Commercial
Enterprises
Change in household recycling collection costs
£129M
Change in bring site costs
£3M
Change in HWRC costs
£1M
Change in litter collection costs
£27M
Saving from reduced expenditure on PRN
system
£30M
Additional cost to retail outlets outside of
t
-£19M
Change in commercial waste collection costs
£36M
Balance
£159M
£47M
Total Saving
£206M
Source: Eunomia
In addition to the financial costs associated with the running of the system, there
will also be environmental impacts that should be monetised and included in the
overall analysis of costs and benefits. The environmental impacts associated with
the introduction of the DRS and the resultant reduction in the collection and disposal
of containers via other waste management routes is summarised in
Table 6-2 and
Figure 6-3. The assumptions that underpin these calculations are presented in
Appendix A.5.0.
Table 6-2: Monetised Environmental Impacts, £millions
Environmental Impact Monetised Value
Recycling (GHG + AQ) £88M
Disposal (GHG + AQ) £6M
Transport -£25M

59
Disamenity of litter £1,248M
Total £1,317M
Source: Eunomia
Figure 6-3: Annual Monetised Environmental Impacts (Complementary System)
£millions 2010 Real Terms
Tangible benefits accrue from the reduction in GHG emissions and air pollutants as
a result of increased recycling and reduced disposal (net = £94M). Costs also occur
from the net additional emissions from vehicles used to collect and process empty
containers. It should be noted, however, that not all transportation impacts are
negative, as there is avoided transportation from a reduction in waste collected at
the kerbside and from commercial premises. Vehicles are subsequently able to
travel further distances before they reach capacity and need to offload or ‘tip’ the
collected waste, which results in a reduction in the number of longer journeys made
in order to ‘tip’ the material and hence in the number of overall vehicles required.
The overall net benefit of these tangible environmental impacts is £69M.
The figure for disamenity is as calculated in Section 5.5, based upon work by
Pricewaterhouse Coopers. We illustrate overall results with and without this figure,
given the absence of UK-specific studies, and the influence on results.
The greenhouse gas benefits of a particular policy, or system, are keenly pored over
by policy makers. We therefore present the quantity of GHG emissions saved, above
the baseline situation, in Figure 6-4.
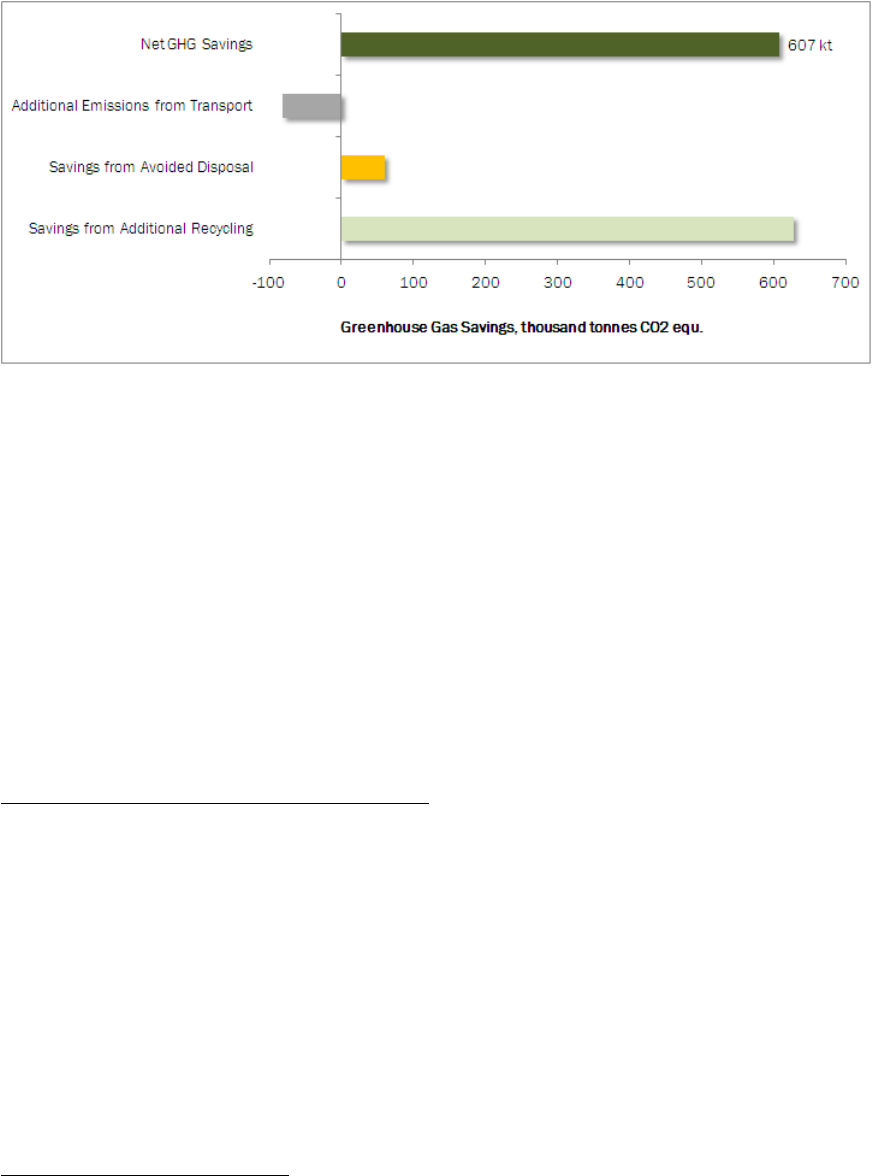
60
Figure 6-4: Greenhouse Gas Savings from the Introduction of a Deposit Refund
System, thousand tonnes CO
2
equivalent
Note that the emissions are presented from a ‘global’ perspective, as the location of
marginal recycling activities is unclear, both in the UK and abroad. In essence, the
value of these benefits, as reported under the UK’s domestic emissions inventory,
would change depending upon the location of the primary and secondary materials
production.
To put this saving into a policy context, the UK Marginal Abatement Cost Curve
(MACC) analysis, undertaken in 2008, estimated that by 2022 the waste sector
could reduce its emissions of carbon dioxide equivalent by around 9 million tonnes,
with the majority of savings (7.5 to 8 million tonnes) coming from biowaste
treatment and a shift from landfill to other residual processes. Therefore, the
savings generated from any level of additional dry recycling, up to the maximum of
607 thousand tonnes, would significantly help achieve the abatement required
under statutory greenhouse gas targets, set out by the Committee on Climate
Change.
80
Putting it All Together - The Whole Picture
The overall costs and benefits to society from the introduction of a DRS in place of
kerbside collections of containers are summarised in
Table 6-3 and Figure 6-5.
It should be noted that Table 6-3 and Figure 6-5 illustrate the net benefit once the
DRS is up and running. It does not include the £84 million one-off costs that would
be associated with the initial setting up of the DRS, as these would only be incurred
over the first year or two of the system. From society’s perspective, depending on the
pay-back period, these costs will be covered within the first few years of
implementation, and would be met by fees payable by producers and retailers as
they join up to the scheme. One-off costs are discussed in more detail in Section 6.4.
80
This is particularly significant since our baseline assumes that kerbside collection systems of a
relatively high quality exist for all households at the time the DRS is introduced.
61
Based on the cost benefit analysis presented in Table 6-3, the key messages from
the overall cost benefit associated with the introduction of a complementary DRS in
the UK are:
¾ DRS costs, from society’s perspective, are around £703 million per annum.
Not all these costs, however, are subsequently met by producers of
beverages. This is because the system’s finances are effectively bolstered by
unclaimed deposits (to the tune of £491 million). Producers, therefore, would
pay only £212 million. The unclaimed deposit is important to represent as a
cost, because if the return rate does approach 100%, then the producers
would have to pay an amount which approximates to the total cost of the
system in the absence of unclaimed deposits (i.e. £0.7 billion);
¾ The cost to producers (net of unclaimed deposits) of operating the DRS is
roughly equivalent to the savings produced from a) a reduction in the
collection of beverage containers by local authorities and commercial
enterprises, and b) a reduction in costs for operating the PRN system.
Therefore the financial costs, net of savings, are close to zero. Other studies
have generally focused upon the lost revenue to local authorities where
materials are no longer available for collection. Quite apart from the fact that
it is known that not all local authorities are securing the full benefits
associated with this revenue stream, the studies have failed to appreciate
that local authorities will save far more in terms of operating logistics than
they lose in terms of material revenues. This is true irrespective of whether
the DRS operates in a complementary or parallel fashion for the simple
reason that a significant proportion of low density packaging materials no
longer have to be collected though kerbside recycling / refuse systems;
¾ Local authorities around the UK are expected to save around £159 million
per year in avoided waste management costs. This is a saving of around £7
per household per annum. In other words, for an average waste collection
authority of 50,000 households, the financial saving in real terms would be
around £360,000 per annum. This is a valued means of saving public sector
costs at a time when cuts are being made to reduce the deficit, and
consideration is being given to the transfer of services to the private sector;
¾ The environmental benefit is significantly different with and without the
disamenity associated with littering. We have included both figures in order
to show the ‘worst-case’ scenario cost benefit analysis, where individuals
place zero value on the removal of litter from their environment, separately
from perhaps a more likely scenario, where individuals are willing to pay
somewhere in the region of £48 per household per annum to remove litter
from the environment. There will, without question, be some disamenity
value that arises through littering, and the analysis presented here shows
that the reduction of containers in the environment could generate a
significant benefit to society;
¾ In our model, a minority of consumers forego £491 million in deposits. There
are interesting questions as to what might lead people to forego deposits in
systems where the aim is to make returns as convenient as possible. There
will be cases where it may be difficult for some individuals to make returns,
62
though for such individuals, there may be others who can gain the returns for
them (or simply ensure no additional deposit is paid on a ‘replacement’
purchase). For others, the calculus may be more simple in that the marginal
income to be gained is too insignificant to warrant any (additional) effort to
regain the deposit, though here, the prospect remains that others will choose
to benefit from the deposit. Nonetheless, this does increase the outlay from
consumers, and is considered as a cost of operating the system, though the
effect is to defray the costs born by the producers;
¾ More research into the disamenity associated with littering would be
desirable in order to firm up the figures in Table 6-3 and give greater strength
to determining the argument for or against the introduction of a DRS in the
UK. Under the current analysis, however, the overall considerations appear
favourable for introducing a complementary system where one incorporates
the disamenity associated with litter; and
¾ For society as a whole, there is a net cost of £428 million where no allowance
is made for the benefits generated from reduced littering. Once this is
factored in, however, the position changes quite dramatically. Indeed, society
derives a net benefit of £820 million. Indeed, the system implies a
benefit:cost ratio of the order 2:1.
Another way of looking at these results is that the benefits to society will be positive
as long as the disamenity associated with the reduction in litter is valued in excess
of £428 million, or around £16.46 per household.
The costs of running the DRS can effectively be summarised as the cost to
producers plus the revenue foregone by consumers in the form of unclaimed
deposits. This is just over £700 million.

63
Table 6-3: Overall Costs and Benefits, £millions – Complementary Scenario
Cost or Benefit (-ve
is a cost), in
£millions
Financial Effects
Deposit Refund System (to Producers)
-£212M
Collection and Treatment/Disposal (to Local Authorities)
£159M
Change in Cost of PRNs (conservative estimate)
£30M
Collection and Treatment/Disposal (to Commerce)
£17M
Consumers (unclaimed deposits)
-£491M
Net Financial Costs
-£497M
Environmental Effects
without disamenity
£69M
with disamenity
£1,317M
Total Benefit to Society
without disamenity
-£428M
with disamenity
+£820M
Source: Eunomia
Note consumer costs are the unclaimed deposits that the consumer ‘loses’ as a result of not
returning their containers in order to collect their deposit

64
Figure 6-5: Summary of Annual Ongoing Costs and Benefits from the Introduction of a ‘Complementary’ Deposit Refund System,
£millions 2010 Real Terms
Note: Positive figures indicate benefits
, negative figures indicate costs

65
6.2 Parallel System
Under the parallel system, the kerbside system remains in operation for beverage
containers alongside the DRS. In our modelling, this has the assumed effect that
some people will continue placing containers in their household recycling or refuse
collection, even though they have paid the deposit, on the premise that the
convenience factor outweighs the financial loss of the deposit. With this in mind the
overall return rate for the system was set at 80%, 10% less than where no return
can be made at the kerbside. Figure 6-6 provides an overview of the costs
associated with the parallel DRS, based on an 80% return rate, and Table 6-4
summarises the overall costs and benefits derived under the parallel scenario.
Figure 6-6: Overview of Parallel Deposit Refund System Costs
80% overall return rate, £millions 2010 Real Terms
The figures presented in Table 6-4 and Figure 6-6 indicate that the net benefits to
society associated with introducing a DRS alongside the existing kerbside collection
are similar to those under the complementary scenario. The main differences are
discussed below:
¾ Given that the return rate of containers placed on the market has been
assumed to be 10% less than under the complementary scenario, ie. 80%,
the value of the deposit (15p or 30p depending on the size of container)
results in a significant revenue being generated from lost or ‘unclaimed’
deposits in the parallel system. Consequently, the unclaimed deposits and
material revenues negate the need for an administration fee to be paid by
producers (see Figure 6-7) and generate a surplus revenue of £249 million

66
for the central system. As is the case in some Nordic countries, this revenue
could be used to fund environmental projects, as well as to invest in further
optimisation of the DRS infrastructure where applicable (for example, to
increase infrastructure to achieve higher return rates);
81
Table 6-4: Overall Costs and Benefits, £millions – Parallel Scenario
Cost or Benefit (-ve is
a cost), in £millions
Financial Effects
Deposit Refund System (to Producers)
£249M
Collection and Treatment/Disposal (to Local Authorities)
£143M
Change in Cost of PRNs (conservative estimate)
£30M
Collection and Treatment/Disposal (to Commerce)
£15M
Consumers (unclaimed deposits)
-£944M
Net Financial Costs
-£508M
Environmental Effects
without disamenity
£65M
with disamenity
£1,313M
Total Benefit to Society
without disamenity
-£443M
with disamenity
+£805M
Source: Eunomia
*Note consumer costs are the unclaimed deposits that the consumer ‘loses’ as a result of not
returning their containers in order to collect their deposit.
81
http://www.dansk-retursystem.dk/content/us/importers_and_producers/deposits_and_fees

67
¾ The corollary of this is that consumers actually incur a greater cost, in the
form of unclaimed deposits, than under the complementary system.
Effectively, what is being modelled is an assumption regarding the response
of consumers to the relative ease with which containers can be dealt with
through the kerbside system and the DRS. This assumption is clearly open to
question. It may well be that a sufficiently well resourced infrastructure would
imply that the differentials in performance may be smaller, especially if the
deposit is seen as ‘worth having’, or if the scheme is considered ‘worth
supporting’; and
¾ Given the lower amount of material being collected in the DRS, the overall
logistics costs were calculated as £15 million lower in the parallel system,
and the material revenues generated were also lower by the order of £22
million. In addition, given that there will be an increase in the number of
containers collected at the kerbside in the parallel system, there is a
resultant decrease in the overall savings available to local authorities of £15
million in comparison to the complementary system.
It should be noted that this modelling does not take into consideration the fact that,
given the size of the deposit, the local authority itself would be likely to implement
measures to separate out the beverage containers in the kerbside scheme, and
claim back the deposits as an income stream. On a per container basis, a collection
authority can gain significantly higher revenue from the redemption of the deposit
than from the sale of the material only.
82
Therefore, it is quite possible that the
authority would go to some effort to ensure that people place containers in the
recycling system rather than in refuse, and to either separate them out in kerbside
sort collections, or install an automated counting machine at a transfer station in
order to redeem the deposits from the central system. Consequently, the figures for
the system could converge with those calculated under the complementary
scenario, with principal differences being related to the cost of installing relevant
separation equipment.
We would thus suggest that both systems could be considered feasible systems for
the UK. However, given that the operational costs are similar between the parallel
and complementary scenarios, and they are likely to converge in any case, it seems
sensible to allow householders to continue to use existing kerbside collection
systems if they so desire. This might also be a more sensible approach given the
existence of containers which bear no deposit (imported by consumers from
abroad).
The overall costs of the DRS are, as with the parallel scheme, given by the cost to
producers plus the revenue foregone by consumers in the form of unclaimed
deposits. This is just under £700 million in this case. The key change between the
parallel and complementary systems, driven by the assumptions regarding return
rates, is the distribution of these costs between producers and consumers. Other
things being equal (notably, the magnitude of the deposit), a scheme with a higher
82
The average revenue per container is 1.7p. This is significantly less than the 15p or 30p deposit.

68
return rate will lead to reduced revenues in the form of unclaimed deposits and
higher costs to producers.
Since DRS costs to producers are lower with lower return rates, it would appear
sensible to introduce target recycling rates for these materials to encourage higher
return rates from the system, and reduce the incentive for poor system design /
inadequate infrastructure. This would also result in the convergence of the
complementary and parallel systems, in terms of return rate. The effect of this is to
lower the revenue generated from unclaimed deposits, thus leading to slightly
higher administrative fees, but with the ultimate outcome that greater
environmental benefits are delivered.
Figure 6-7: Revenue Source under Parallel System
Source: Eunomia
6.3 Sensitivities
In order to understand the robustness of the results and conclusions presented
above, we have undertaken a series of sensitivity analyses. The results from these
analyses are detailed in this Section. Given the discussion above in relation to the
parallel system, all of the sensitivities presented relate to the results under the
complementary scenario.
The sensitivity analyses are first undertaken as discrete elements, in order to explore
the relationship between each key variable and the overall cost benefit associated
with introducing the deposit scheme. Thus each sensitivity is run under the
assumption of ‘all other things being equal’. Testing of the overall results, using
multivariable analysis, is described at the end of the section, in order to identify
those variables that have the most significant influence on the results that have
been obtained in this study.

69
6.3.1 Change in Automated vs Manual Take-back
As part of the sensitivity analysis, we explored what might happen if more retail
outlets were able to install RVMs that allowed them to clear and compact containers
on site, rather than requiring more regular manual collections. It is worth noting that,
although as modelled here, the cost of a consumer friendly machine destined for the
supermarket forecourt is around £17,000, a simple RVM designed more for smaller
shops and back-rooms/ storage areas might cost as little as £4,500 to £8,500. If a
greater number of retail outlets were to install these simple RVMs to streamline the
take-back process, then the collection logistics would be significantly optimised due
to the higher bulk densities of the material and the elimination of counting centres.
If the setup of the system is changed so that at least 80% of retailers can install on-
site automated takeback systems, then 160,000 machines would be required in
addition to the existing 40,000 modelled in the central case. In both cases the net
benefit changes to a cost, when disamenity is not considered, but it is still a benefit
when litter disamenity is included.
This shows that despite the savings from optimised collections, and less down-
stream processing, the number and capital cost of RVMs play a significant role in
the financial costs of the system.
Table 6-5: Overall Costs and Benefits, £millions – Take-back Methodology Sensitivity
Central
Case
€5,000
Machine
€10,000
Machine
RVM Costs £209
£226 £419
Collection Costs £323
£252 £252
Total Benefit to Society
without disamenity
-£428
-£511 -£721
with disamenity
+£1.2B
+£737 +£527
Source: Eunomia
6.3.2 Change in Collection Logistics
Under the central complementary scenario, it has been assumed that most of the
larger stores will be able to utilise backhauling (see Appendix A.3.2.6).
83
If this is not
the case, or conversely if distribution companies are able to backhaul from much
smaller premises, the overall collection requirements of the system will change
significantly. In the central scenario, we have modelled that around 37% of retail
outlets will be able to utilise backhauling. This is based on estimates of the
83
Note that backhauling refers to the return trip that is made by a truck after delivering a load to a
specified destination. This return trip, on which the truck would otherwise be empty, is used, where
possible, to transport items back to where the truck journey commenced from.

70
proportion of each retail category able to backhaul. The key assumptions in the
setting of these conditions were:
¾ All supermarkets are of a large enough size to backhaul;
¾ 70% of medium sized stores would be large enough to backhaul;
¾ 20% of convenience stores will be serviced by large-scale distribution
companies which will backhaul;
¾ Half of pubs (whose main trade is beverages) will be supplied by a
distribution company large enough to backhaul. In practice many pubs are
supplied by a small number of large suppliers or breweries, so in reality the
potential for backhauling using existing collection logistics could be more
substantial than estimated; and
¾ The potential for backhauling is diminished when considering other catering
sectors due to the lower volumes of containers per outlet.
37% of retail outlets equates to around 50% of the total number of containers in the
system, and containers are the single most significant cost in the dedicated
collection round logistics.
Table 6-6 shows the change in cost benefit if these assumptions are altered.
Table 6-6: Overall Costs and Benefits, £millions – Collection Logistics Sensitivity
Central
Case - 37%
Outlets
Backhauling
10% Outlets
Backhauling
80% Outlets
Backhauling
Collection Costs £323
£423 £227
Total Benefit to Society
without disamenity
-£428
-£534 -£326
with disamenity
+£1.2B
+£714 +£922
Source: Eunomia
It can be seen from Table 6-6 that the results are sensitive to the input assumptions
regarding backhauling. Shifting between low and high values for backhauling
changes costs, relative to the baseline, by +/-£100 million or so. Given the large
number of supermarkets in the UK retail landscape, and their likely desire to want to
backhaul where reverse vending machines are installed in their outlets, it seems
unlikely that less than 10% of retail outlets would be engaged in backhauling.
84
84
Personal communication with Tesco during the TOMRA RVM trial, 2009.

71
6.3.3 Change in Environmental Assumptions
The way in which emissions to the environment are valued and the price that is used
will both have a significant bearing on the results obtained. Details of the way in
which carbon and air quality valuations have been undertaken are discussed in
Appendix A.5.0. Two sets of damage costs have been considered in this study - the
UK Government’s Interdepartmental Group on Costs & Benefits (IGCB) damage costs
and the Clean Air for Europe (Café) damage costs.
85
These datasets use slightly
different values in their assessment of damage costs. The Café data set was used
for the cost benefit analysis presented here in the central case. Table 6-7 illustrates
that when using the UK Government’s Interdepartmental Group on Costs & Benefits
(IGCB) damage costs as opposed to the Clean Air for Europe (Café) damage costs,
there is a reduction in environmental benefit of around £21 million in air quality
benefits.
Table 6-7: Overall Costs and Benefits, £million – Change in Environmental
Assumptions
Central
Air Quality –
Café to IGCB
Damage
Costs
Increase in
additional
journeys by
consumer –
10% to 50%
Average
Emissions
Standard
Euro 5 to
Euro 6
Environmental Costs £70
£49
-£8 £87
Total Benefit to Society
without disamenity -£428
-£449
-£506 -£411
with disamenity +£1.2B
+£799
+£742 +£837
Source: Eunomia
Furthermore, in assuming an increase from 10% to 50% in the number of additional
(dedicated) trips that the consumer might make solely to drop off their deposit-
bearing containers, there would be a reduction in environmental benefit of
£78million. Finally, if we assume that the vehicles required in the deposit refund
collection logistics are of Euro 6 emissions standard (a more stringent standard
which the UK’s vehicle fleet will have to meet in the future) rather than Euro 5, there
is an overall reduction in vehicle emissions, generating an additional £17 millon of
environmental benefit in comparison to the central scenario.
In addition to these impacts, and as discussed previously, the disamenity associated
with littering is also uncertain. Hence all results have been presented both with and
85
Damage costs are a way of converting an environmental impact into a financial impact, by looking
at the financial costs to society of some form of environmental impact. In this case, for air quality
impacts, this is done through assessing the cost to society of people’s ill health that results from air
pollution. In the case of climate change, this is done by calculating the financial cost to society of
putting in place measures to reduce climate change impacts associated with greenhouse gases.

72
without the potential benefit to society associated with the removal of litter from the
environment.
Table 6-7 shows the change in environmental costs associated with each of the key
changes in the environmental assumptions. When considering total benefit less
litter disamenity, the increase in dedicated journeys by the consumer does take the
overall benefit to society over the tipping point – all other things being equal.
However, when disamenity is considered, none of the sensitivities challenge the
robustness of the overall conclusions.
6.3.4 Potential Switch in Manufacture Away from Deposit-Bearing Containers
Though not forming part of the scope of this study, it is perhaps worth briefly
discussing the potential switch in choice of container material in order to avoid the
DRS. In the recent study undertaken by ERM on DRSs, it was noted that the over-
riding issue in the manufacturer’s choice of which material to use to contain
beverages was centred on consumer acceptance, rather than on avoidance of being
in a deposit scheme.
86
However, the study did note one example where the
manufacturer had changed their material choice specifically because of the DRS,
with one producer in Sweden switching to a bottle made from plastic that was not
part of the scheme. Subsequent adjustments to the legislation brought that
particular product back into the DRS. However, this might not be as easy if, for
example, the producer were to turn to cartons or pouches as alternative
containment methods.
Policy makers should, therefore, be aware that some equivalent form of extended
producer responsibility for those beverage containers falling outside the DRS might
be necessary in order to avoid the shift to materials that are not so easy to include in
DRSs for technical reasons. A clear problem with the existing producer responsibility
system is that the costs of complying with obligations do not fall fully upon the
obligated companies. A considerable part of the cost of meeting targets for
packaging waste recycling is met through central government grant and Council Tax,
so that there is very little incentive for packaging waste producers to be mindful of
the recyclability of the retail packaging they place on the market.
A range of instruments could be used to ensure that the incentives for product
switching are reduced. Simply put, it would make sense for producers to be obliged
to achieve high rates of recycling of packaging and to meet the costs of doing so (as
under the DRS). Alternative mechanisms such as packaging levies could be used to
influence the materials chosen by manufacturers. Denmark effectively discharges
its packaging waste obligations through a combination of taxes and deposit refunds,
with the tax rates varying depending upon whether the packaging falls within or
outside a deposit scheme.
87
86
ERM (2008) Review of Packaging Deposits System for the UK, Final Report produced for Defra,
December 2008.
87
Eunomia (2009), International Review of Waste Management Policy: Annexes to Main Report,
Report for the Department of the Environment, Heritage and Local Government, Ireland, p.316-321

73
6.3.5 Multi-Variant Analysis in Cost and Environmental Performance
A significant number of variables are included in the cost benefit model. To test all
inputs and possible outcomes would require significant time, and would not
necessarily provide any further understanding of the fundamental financial impacts
associated with the introduction of a DRS in the UK. However, as discussed
previously, to simply consider a range of discrete scenarios makes it difficult to
obtain an overall idea of the ‘worst’ or ‘best’ case outcomes.
A simulation tool called Crystal Ball® was thus used to perform Monte Carlo analysis
on the key inputs, and record the range of results. The goal of Monte Carlo analysis
is to determine how random variation, lack of knowledge, or error affects the
sensitivity, performance or reliability of the system that is being modelled. ‘Monte
Carlo’ simulation is categorised as a sampling method, because the inputs are
randomly generated from probability distributions to simulate the process of
sampling from an actual population. The key variables tested in the model are given
below (larger variations have been given to assumptions which are less certain):
88
¾ Deposit Refund System Costs:
• Material Revenues +/- 20%
• Total Transport Cost +/- 50%
• Total Container Costs +/- 50%
• Total Counting Centre Costs +/- 20%
• RVM Unit Costs +/- 30%
• Labour Costs +/- 50%
• Retail Floorspace Rateable Value +/- 50%
• Deposit +/- 20%
• Central System Administration Cost + 200%/ - 50%
¾ Existing Waste Collection Costs
• Bring Site Costs +/- 80%
• HWRC Costs +/- 80%
• Litter Collection Costs +/- 80%
• Commercial Collection Costs +/- 80%
¾ Environmental Costs
• Unit Damage Costs for Air Emissions and GHGs +/- 50%
• Littering Disamenity Benefits £10 to £50 per household
• Transport Damages – Additional Miles +/- 80%
88
All inputs are varied linearly between the limits given.
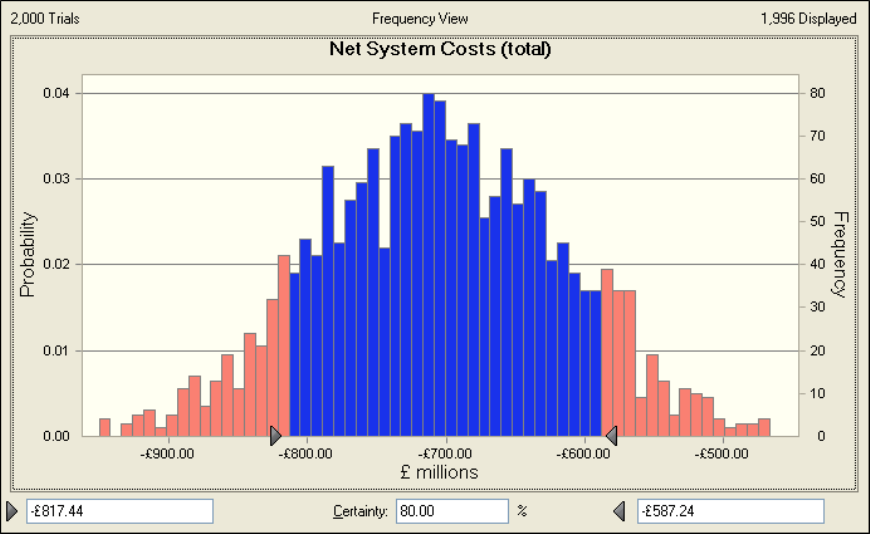
74
¾ Mass Flows:
• Return Rates 85% to 95%
Figure 6-8 to Figure 6-12 show the outputs from the simulation. They represent a
probability distribution based upon the inputs described above. The certainty of the
result falling between the upper and lower bounds (the blue area) is shown at the
bottom of the chart.
Figure 6-8: Monte Carlo Analysis – Net Costs for DRS
Source: Eunomia
Figure 6-8 shows that the costs of the DRS system have an 80% likelihood of lying
between £587 and £817 million. These costs are, as was highlighted earlier, made
up of the costs to producers and the unclaimed deposits from consumers. These two
components are shown in Figure 6-9 and Figure 6-10. Producer costs show an 80%
likelihood of lying between £67 and £443 million, whilst unclaimed deposits are
80% likely to lie between £303 and £605 million.

75
Figure 6-9: Net Costs to Producers
Figure 6-10: Cost to Consumers (Unclaimed Deposits)

76
Perhaps the most important figures are those for the net benefit to society. In the
case where no benefit from disamenity is included, Figure 6-11 shows that the costs
are 80% likely to lie between £311 and £537 million.
Figure 6-11: Monte Carlo Analysis – Net Benefit to Society (without Littering
Disamenity)
Source: Eunomia
Once disamenity is included, the picture changes radically. As Figure 6-12 shows,
there is an 86% likelihood that benefits will exceed costs. In the central 80%
likelihood interval, the net benefits to society range from -£43 million to
+£769 million. The most likely outcome is a net benefit to society of £365 million.
The important conclusion therefore, when including the disamenity associated with
litter, is that there is a strong likelihood that the benefits will exceed the costs.
The final presentation, in
Figure 6-13, shows how the figures appear if one adopts
the view that unclaimed deposits are ‘voluntarily’ foregone, and if one excludes
them from the costs of the DRS. This shows that under this assumption, the net
benefits are always in excess of zero. The benefit figures are 80% likely to rest
between £376 and £1,244 million. Strictly speaking, this ignores costs which are
incurred by consumers, but it might be argued that these costs simply represent
income that the consumers have chosen to forego. The validity of this line of
argument clearly depends upon the adequacy (convenience) of the infrastructure for
beverage container returns. Furthermore, if schemes are highly successful in
generating returns, then clearly, the unclaimed deposits fall close to zero and
Figure
6-13 appears very much as Figure 6-12 above.

77
Figure 6-12: Monte Carlo Analysis – Net Benefit to Society (with Littering
Disamenity)
Source: Eunomia
Figure 6-13: Monte Carlo Analysis – Total Benefit to Society (with Littering
Disamenity), and Excluding Costs Incurred by Consumers as Unclaimed Deposits

78
The key sensitivities in the model can also be extracted from within the simulation
software. In examining the implementation of a DRS in the UK, it is important to
note that the five most influential variables affecting the value of total benefit to
society are:
1) The value of disamenity per household associated with littering (65%
contribution to variance);
2) The return rate of containers into the system (14% contribution to variance);
3) The deposit applied to the containers;
4) The space costs of retail floorspace; and
5) The total costs of transporting containers during collection and processing.
This indicates that more research into the disamenity associated with littering,
potential return rates and deposit value would help in providing greater robustness
to the results.
6.4 One-Off Costs
Little detailed and sourced information appears to be available on the initial set up
costs that would be required for a DRS in the UK. We therefore constructed the costs
that we believe would be associated with setting up this type of system, based
primarily on what tasks would be required and when (provided by TOMRA), and the
associated number of days that would be required for each task.
89
A breakdown of
the key tasks involved and the resource and capital costs that we suggest would be
involved in developing and implementing the system are given in Table A-27 in
Appendix A.3.6.
Based on the modelling, a total cost of £32 million would be required to set up the
central DRS, plus an additional £1.25 million for the producers to change their
labelling, and an additional £51 million for the retailers to adapt their store areas to
accommodate the new system requirements. In addition, significant investment
would be required in order to purchase infrastructure such as RVMs and counting
centres. It is unlikely, however, that these would be purchased outright; rather the
typical approach in existing systems seems to be to finance this infrastructure over a
number of years (modelled at around 5 years for RVMs). We have thus incorporated
these annualised costs into the overall ongoing logistics costs of the system.
There is a dearth of detailed information on the overall set-up costs of existing DRSs.
We could find no credible sources on the detailed calculation of joining fees for
either producers or retailers which would be required to cover these one-off costs.
Joining fees vary across existing deposit schemes and can also vary from year to
year (to compensate for changes in return rates and material values, and hence the
subsequent cost of the overall DRS). For example, in Finland, the producer can
currently opt to pay either a one-off lifetime joining fee of £6,698, or an annual
89
TOMRA (2001), Zentrale Organization Einweg Pfand Deutschland: Business Model Development
Guide.

79
joining fee of £1,498 over a 5 year period, and must also pay a per product
additional fee of around £300 in both circumstances.
90
In Denmark, the joining fee
for producers is currently set at £238 per annum, and retailers also pay an annual
fee of £59 to make them eligible to receive handling fee payments.
91
In Norway, a
one-off joining fee of £3,307 is currently charged for each producer, plus an
additional £551 per product.
92
For the purposes of this high level modelling, we have thus not attempted to split
the one-off costs into joining fees per producer or per retailer. However, based on
fees in existing deposit schemes, given the size of the one-off costs presented here
and based on the number of producers and retailers, it can be expected that the
average fee for producers might be somewhere around £3,000 to £5,000 (to be
paid as a one-off or over several years) with a per product fee in the region of £300,
and an average retailer fee of around £100 to £200.
93
A number of key decisions
would require further consideration beyond this study in order to determine how the
one-off costs of the system would be covered, including the following:
¾ Should both the producer and the retailer be charged a joining fee?
¾ If so, how should the one-off costs of the central system be split between the
producer and the retailer?
¾ Should the joining fee be a one-off membership, or an ongoing annual fee?
¾ Should a per product fee be charged on top of a more general fee in order to
reflect the size of producer?
¾ Should the retailer joining fee vary according to annual turnover or some
other equivalent measure?
6.5 Single Market Considerations
Care has to be taken in designing DRSs in Europe such that they are proportionate
in their effect, and do not effectively become trade barriers, or obstacles to the free
movement of goods within the EU Single Market, in ways which are disproportionate
relative to the environmental outcome being sought.
One of the concerns within Europe has been the distributional impact across
domestic and foreign producers of beverages. Several documents highlight the
potential for DRSs to place foreign producers at a disadvantage relative to domestic
producers, the argument being that there is a protectionist slant to DRSs, and that
they fragment the Single Market. In May 2009, the European Commission issued a
90
http://www.palpa.fi/english,exchange rate at 0.8813
91
http://www.dansk-retursystem.dk/content/, exchange rate at 0.1189
92
http://www.resirk.no/Calculator-83.aspx, exchange rate at 0.1102
93
Based on approximately 1,000 producers and 185,000 retailers; if retailers were, for example, to
cover 70% of set-up costs, this would equate to joining fee of £119 per retail outlet. Remaining costs
would be then be covered by producer one-off fees of £3500 plus a per product fee of £300, based
on an average of 20 products per producer (Coke has approximately 300 products on the market,
whereas smaller firms might have less than 10).

80
Communication on Beverage packaging, deposit systems and the free movement of
goods:
94
While regulatory steering measures taken at Member State level in order to
introduce systems for the reuse of beverage packaging may serve
environmental goals, they also have the potential to divide the internal
market. For market operators engaged in activities in several Member States
these systems often make it more difficult to take advantage of business
opportunities within the internal market. Instead of selling the same product
in the same packaging in different markets, they are required to adapt their
packaging to the requirements of each individual Member State, which
usually leads to additional costs.[…]
Past experience and ongoing cases show that the adoption of unilateral
measures in different Member States still poses problems. In particular,
infringement procedures in the beverage sector have shown that national
measures can lead to distortions of competition and, in some cases, to the
partitioning of the internal market, which runs counter to the internal market
aim of Directive 94/62/EC.
Whilst there is clearly an issue associated with DRSs, there are other ways in which
the Single Market remains fragmented, partly owing to the degree to which national
authorities still exercise control over the workings of the domestic market. In many
respects, the principle of subsidiarity (which tends to give Member States
considerable freedom in the way they transpose EU legislation into domestic
legislation) tends to limit the extent to which a Single Market can ever be said to
exist. Notwithstanding the objectives to see this ideal realised in practice, this can
only really happen if Member States simply abrogate complete responsibility for
policy making to the European Parliament. This seems an unlikely outcome, and not
just in the near future. Consequently, the fragmentation of the internal market
remains a fact of life.
We note in passing that the UK has a strict packaging code developed and
implemented relatively recently by the Food Standards Agency (FSA). This requires
UK specific packaging to be produced. Therefore, there would be little additional
burden to producers for developing UK specific packaging, and logistics following the
implementation of a DRS, if this was already the case.
The Communication is presented as a list of ‘do’s’ and ‘don’ts’ for Member States to
assist them in the design of their policies in such a way that problems in respect of
the internal market are minimised or eliminated. It is important to note, however,
that what the Communication very clearly avoids saying is that DRSs are not legal. It
merely highlights the fact that the design of such systems should be carefully
considered, particularly with regard to their effect on the workings of the internal
market. Moreover, it recognises that such schemes can be justified even where they
may be construed as barriers to trade:
94
European Commission (2009) Communication from the Commission on Beverage packaging,
deposit systems and the free movement of goods, C(2009) 3447 final Brussels 8
th
May 2009.

81
The fact that they would qualify as a trade barrier, however, does not prevent
these national provisions from being justified on grounds relating to the
protection of the environment. According to the Court of Justice, a deposit
and return system may increase the proportion of empty packaging returned,
and at the same time lead to a more targeted sorting of packaging waste.
Moreover, it may help prevent littering, as it gives consumers an incentive to
return empty packaging. Finally, insofar as those national provisions
encourage the producers or distributors concerned to have recourse to
reusable packaging, they contribute towards a general reduction in the
amount of waste disposed of, which is a general goal in environmental policy.
In practice, this means that Member States are allowed to introduce
mandatory deposit systems if, on the basis of the individual Member State's
discretion, this is considered necessary for environmental reasons.
It goes on to note, however, the need for a balanced and proportionate approach:
If a Member State opts for a mandatory deposit and return system, it must
nevertheless observe certain requirements in order to ensure that a fair
balance is struck between environmental objectives and internal market
needs. In view of the additional burden on imported products, such systems
must take note of the specific situation and must use means which do not go
beyond what is necessary for the purpose envisaged.
It then describes approaches considered to be appropriate in the case where such
schemes are introduced. This advice appears sound in the light of the considerable
opposition which such schemes have engendered in respect to internal market
effects.
Our analysis highlights the fact that particularly if the environmental disbenefits of
littering are concerned, the overall change in costs are justified by the environmental
benefits. In this respect, the approach could not be said to be disproportionate, and
ought, therefore, to have much to recommend it. Much depends, of course, upon the
efficiency with which the system is designed and operated.
The OECD reports that DRSs can create barriers to trade under the following
circumstances:
95
¾ if the initial deposits are high compared to the value of the goods;
¾ if foreign producers see that the costs of participating in a co-operative
retrieval and recycling scheme are out of proportion to their market share;
¾ if non-refillable containers are an important condition for the competitiveness
of imports;
¾ if they are applied only to certain types of containers or packaging which are
primarily used for imported products; or
¾ if they are applied in a fashion which is discriminatory or which unduly
favours domestic products.
95
OECD (1993) Applying Economic Instruments to Packaging Waste: Practical Issues for Product
Charges and Deposit Refund Systems, Paris: OECD.

82
The OECD concerns reflect those which might be of concern to the World Trade
Organisation. They principally concern the desire to ensure that DRSs are not
disguised measures to protect national producers. Again, there seems no reason to
believe that would be the case in our proposed design, as UK producers are no less
likely to use the targeted materials than foreign producers.
The system we have proposed does not appear to fall foul of any of the OECD
concerns. Some might argue that for some products, the deposit will be quite high
relative to the value of the goods. This is a somewhat subjective matter, but the
deposit levels here do not seem out of step with other systems.
Another concern in Europe has been the need to ensure sufficient infrastructural
provision to cope with increased / altered collection and reprocessing requirements.
This would also seem to be covered in our proposed design.
96
In their review of the Oakdene Hollins study, Perchards suggest that the inclusion of
wine bottles may be problematic:
We would warn against the inclusion of wine bottles in a DRS. Participation
in a DRS usually requires special marking requirements (a machine readable
logo or bar code that an RVM can identify) and may result in higher
compliance costs. Because the UK produces hardly any wine, these burdens
would fall solely on importers. This would be vehemently challenged as a
barrier to trade – particularly by the French wine producers.
It should be noted that no mandatory European deposit system includes
wines or spirits bottles.
In our model, we have included wine and spirits bottles. The aim of the system was
to be as comprehensive as possible, and it could reasonably be argued that to
exclude wines and spirits would be more discriminatory than their inclusion. The
wording of the OECD above is instructive in that it argues that the measure would
constitute a barrier to trade only if it affected products which are primarily imported.
If all policy measures were conceived in such a way that for any product which was
principally imported, exemptions were to be applied, then all policy would become
ridiculously complex, with imports effectively considered as beyond the remit of
domestic policy. Furthermore, wine bottles (and also spirit bottles) are included in
mandatory deposit schemes in Iceland (a country in the European Economic Area
(EEA)) and Israel, and South Australia and Finland are to introduce this capability
soon.
97
6.6 Cross Border Issues – Private Trade in Alcohol bringing Non-
Deposit Containers into the UK
We note this issue because a) the scale of cross border trade is significant and b) it
could be claimed by opponents of deposit systems to be a critical issue. The key
96
European Commission (2009) Communication from the Commission on Beverage packaging,
deposit systems and the free movement of goods, C(2009) 3447 final Brussels 8
th
May 2009.
97
Communication with Hans F. Lauszus (Anker-Andersen).

83
driver is the relative price of beverages. This price may fluctuate from region to
region based upon local conditions, but the two most significant factors on relative
pricing between countries are 1) exchange rates and 2) excise duty on alcohol.
Significant differentials in price were found in a 2001 EU customs report between
UK and France.
98
Assuming the relative costs of manufacturing and transport are not significant (or,
equivalently, that consumers buy in bulk to minimise these) it is clear that one of the
key drivers on the price of beer is duty. One can see why consumers cross the border
from the UK to France to purchase alcohol, much of it beer and wine.
The customs report also noted that:
“we see that the UK loses most revenue [alcohol duty], at €400 million per
annum”
“There is significant smuggling in the UK, particularly on beer”
Additionally, the effect of exchange rates will also impact on the relative price of all
beverages, not just those which attract an excise duty.
It is clearly possible that, notwithstanding the fact that the deposit is a temporary
payment (and is returned when the can is returned) that some consumers might
perceive it as more beneficial to shop in other countries, such as France or Ireland.
PRO-Europe claims:
“Consumers tend to try to avoid paying deposits by shifting to deposit free
products. This includes shopping in stores across borders where mandatory
deposits are not applied. Consequently, retailers in the border region are
faced with tremendous loses due to ‘customer migration’.”
Source: PRO-EUROPE Position Paper Mandatory Deposit Systems
99
However, it seems that cross-border purchases between the UK and France already
occur, and in the case of a deposit system in the UK consumers will be more
motivated by the existing ‘without deposit’ differentials in price (i.e. alcohol duty),
rather than the deposit itself (which will be less than the average difference in price
of a can of lager, for example).
This private trade would cause a problem if, for example, containers purchased in
France were not able to be accepted by the DRS return mechanisms in the UK. If
RVMs or automated counting centres did not hold relevant European Article Number
(EAN) codes, the systems would reject the containers and consumers would not be
able to return them in this manner. This problem is easily overcome, even without
the parallel operation of existing kerbside collection systems; if existing kerbside
schemes remained consumers would simply return the empty containers in these
98
Customs Associates Ltd (2001) Study on the competition between alcoholic drinks, Final Report
February 2001,
http://ec.europa.eu/taxation_customs/resources/documents/study_comp_between_alcoholdrinks_
en.pdf
99
Pro-Europe (n/a) PRO EUROPE Comments on: Mandatory Deposit Systems for One-Way Packaging,
http://www.pro-e.org/files/08-11_Position_Paper_Mandatory_Deposit_RBV01.pdf
84
schemes if they were rejected (or for travellers into the UK existing bring or ‘on-the-
go’ recycling services could be utilised).
However, to ensure that the consumer does not lose confidence in the system, and
become irritated when containers are rejected, memory cards in RVMs should be of
appropriate size to enable them to hold all relevant EAN codes from France and
Ireland prior to construction (a minimal incremental cost). This would mean that the
system would recognise the container and it would be accepted, and transferred to
reprocessors. Clearly no deposit would be paid back to the consumer, and no admin
fee would be paid by the French, for example, beer producer, but the central system
would benefit from the sale of the material. This would be especially beneficial in
the case of aluminium cans.
7.0 Summary and Conclusions
In this report we have investigated the environmental and financial implications of
the introduction of a UK-wide DRS. The research question that we were aiming to
answer through this study was:
‘How do the benefits of introducing a UK-wide DRS for certain beverage
container packaging compare with the costs of implementation and
operation?’
In modelling a potential deposit refund model for the UK, we were able to examine
closely the costs and revenues that might be involved in the implementation of a
DRS. Based on existing examples, we calculated that a deposit of 15p and 30p
would be required for beverage containers of ≤500ml and >500ml respectively in
order to achieve a return rate in the region of 90% for the glass bottles, cans and
PET bottles that we included in the DRS. The majority of the cost calculations for the
system centred firstly on how retailers would take back the returned containers
(automatic machine or manual) and the associated compensation that they would
thus require, and secondly on the subsequent collection, counting and transport of
those containers to re-processors. Hence a significant part of the modelling was
based on building up a picture of the retail landscape across the UK. On-going
administration costs for the system were also factored into the modelling.
Based on the complementary scheme as being the central scenario (where beverage
containers are only collected in the DRS and not in kerbside recycling), we
calculated that the DRS on its own could cost somewhere in the region of £700
million per annum. With an assumed 90% return rate, the costs are distributed
across producers, in the form of a 0.7p administration fee on each container placed
on the market, and consumers, to the extent that they choose to forego the possible
income from the deposit. Most of the administration fee would be expected to be
passed onto consumers, though even if the producers decided to pass 100% of this
cost, there would probably be very little change in terms of volume of sales given
that the additional cost per unit is relatively low, and the demand elasticity is not
especially high.
In the parallel scenario, we assumed a return rate at 10% less than in the
complementary scenario, with the rationale being that convenience would prevail if
the kerbside system was still in operation. Due to the value of the deposit,

85
significant revenue was thus generated from lost or ‘unclaimed’ deposits which,
combined with slightly lower overall DRS costs, generated revenue from unclaimed
deposits which exceeds the cost of the DRS.
Given the size of the deposits (relative to the revenue from material sales), however,
the return rate would be likely to converge on that of the complementary system, be
it due to individuals or the local authority itself extracting containers from the
kerbside collections in order to redeem the deposit. Consequently, the costs falling
on producers might move closer to those suggested under the complementary
system, with local authorities / waste companies realising some of the value of the
unclaimed deposits foregone by consumers.
Since both systems could be considered feasible systems for the UK, then given that
the operational costs are similar between the parallel and complementary
scenarios, and they are likely to converge in any case, it seems sensible to allow
householders to continue to use existing kerbside collection systems if they so
desire.
Importantly, we also included the resultant savings that would be achieved in other
waste management routes, particularly at the kerbside, as a result of the
introduction of a DRS. The removal of containers altogether from the kerbside
collection system, and a slight reduction in containers at bring sites, HWRCs, in
street sweepings and from on-the-go recycling results in a saving of around
£159 million per year for local authorities in avoided waste management costs. This
is a saving of around £7 per household per annum. The additional producer
administration fee costs for the DRS are more or less offset by the savings derived
from other waste management routes. In effect, the overall cost is shifted
specifically onto producers and consumers rather than the population as a whole.
We also examined the environmental impacts associated with the introduction of a
DRS, taking into account the positive impacts associated with increased recycling
and reduced disposal of beverage containers, and the negative impacts associated
with increased transportation required by consumers in returning containers to
collection points, and in the collection and transport of containers from the retail
outlet to the counting centres and beyond. The overall balance of environmental
impacts associated with the introduction of a DRS is a benefit of around £69 million.
The additional recycling from the introduction of a DRS could save up to 607 kt CO
2
equivalent per annum, which would also significantly help achieve the abatement
required under statutory GHG targets, set out by the Committee on Climate
Change.
100
Finally, we have also taken the first steps towards trying to ascertain the potential
environmental disamenity associated with litter in the environment, and the
potential financial benefit that consequently results from a reduction in beverage
containers present in the environment due to the deposit refund policy. We reasoned
that this benefit could be somewhere in the region of £1.2 billion per annum.
100
This is particularly significant since our baseline assumes that kerbside collection systems of a
relatively high quality exist for all households at the time the DRS is introduced.
86
We also attempted to construct the one-off costs that would be associated with the
set-up of a DRS in the UK. Based on the modelling, a total cost of £32 million would
be required to set up the central DRS, plus an additional £1.25 million for the
producers to change their labelling, and an additional £51 million for the retailers to
adapt their store areas to accommodate the new system requirements. These one-
off costs are certainly not insignificant amounts; however, given the large number of
producers and retailers involved in the UK market, it should be possible to split the
costs sensibly in order to ensure that the subsequent joining fees are both
reasonable and manageable for both producers and retailers.
The combined overall cost benefit analysis indicates that, even with the additional
costs incurred in the running of the DRS, there is a high likelihood of a significant
net benefit to society. The influence of the reduction in disamenity associated with
litter appears to be particularly strong. Although there is some uncertainty regarding
the magnitude of this, the suggestion is that if households experience a level of
disamenity of the order £16 or so for the removal of 80% or so of beverage related
litter, then the system makes sense from the perspective of society.
To conclude, the modelling indicates that the introduction of a DRS in the UK is:
a) Likely to cost around £84 million per annum to set up if well designed;
b) Likely to cost around £700 million per annum to run (net of revenues);
c) Unlikely to introduce very significant costs to producers. Even at 90% return
rates, in our modelling, the unclaimed deposits fund around 70% of system
costs;
d) Likely to generate savings to local authorities (and hence, to reduce the burden
of taxation) by around £160 million;
e) Likely to deliver strong environmental benefits in terms of:
i. reduced greenhouse gas emissions and air pollutants, mainly from increased
recycling, in the region of £69 million; and
ii. additional benefits associated with the reduction in the disamenity
associated with litter, potentially in the region of £1.2 billion.
Therefore, the case for the introduction of a DRS appears fairly compelling. Even
where we use Monte Carlo analysis to vary the benefits associated with reduced
litter (with the reduced disamenity varying between £10 and £50 per household on
a random basis), the likelihood of net benefits accruing is 86%. This may be
conservative given that our central estimate for disamenity is of the order £48 per
household per year.
With this in mind, a number of key recommendations have been developed for UK
policy makers. These are presented below.
A DRS can arise as a consequence of a decision to implement a mandatory scheme,
or as a response, from industry, to high recycling targets. Defra has argued (albeit,
we suggest, on limited evidence) that there are alternative schemes which can
achieve the same outcomes as DRSs at a lower cost. The evidence in support of this

87
view is thin, with only Belgium achieving recycling rates approaching the levels
achieved in DRSs (and then, not for PET bottles, for example). Belgium has a
producer responsibility scheme in place which is fully funded by obligated industry. It
also sets targets well above those prevailing in the UK at present, and also has near-
universal implementation of so-called pay as you throw schemes at the household
level, a policy which the Coalition Government has clearly set itself against. Finally, it
is not clear how levels of beverage container litter compare between, for example,
Belgium and those countries where DRSs generate high return rates.
Recommendation 1: The UK Government should introduce a deposit
refund system
Even if other systems could meet the recycling rates achieved by DRSs, there is
scant evidence that they can achieve the same benefits in respect of litter reduction.
The environmental benefits associated with litter reduction are dominant in this
analysis. Therefore, it is clear the Government must consider a DRS from the
perspective of achieving high return rates for recyclable beverage containers, and
significantly addressing beverage container litter.
The research carried out in this report suggests a DRS can:
• Increase recycling rates of beverage containers through rewarding returns;
• Reduce litter by generating an incentive to ‘not throw’ away’;
• Generate environmental gains both in terms of reduced litter and reduced GHG
emissions
In addition, a DRS is a significant mechanism which can be used to deal with
beverage containers (and other packaging) which will reduce the costs to central
government, local authorities and taxpayers of dealing with packaging. This is a
particularly relevant factor in the current economic climate.
DRSs are not always mandatory. They can arise from the setting of high targets for
producers to meet, with DRSs becoming the means to meet those targets. There
are, however, difficulties to be overcome in setting litter reduction targets, hence our
recommendation in favour of a DRS. Even so, in order to ensure that the DRS is
established with convenient infrastructure for returns, it makes sense to set targets
for recycling of beverage containers.
Recommendation 2: High targets should be set for the recycling of all
beverage containers, irrespective of material type
Targets are a pre-requisite for a well-functioning DRS since, in their absence,
schemes may be designed which are inconvenient, deliver low recycling rates, and
lead to high levels of unclaimed deposits, which may even become a source of

88
revenue.
101
We also note that these targets should apply even to materials and
container types which are not so easily included as part of a DRS, to prevent
producers switching between container types which are, and are not, subject to
targets.
Our study has suggested rates of deposit expected to generate return rates in the
order of 90%. We suggest, therefore, a target rate of 85%, in the first instance, is set
for the targeted beverage containers. Sanctions should be considered in the event of
non-compliance.
In principle, were a DRS to be introduced, whether of mandatory nature, or in
response to the existence of targets, we would recommend the following:
Recommendation 3: A central system should be established to
administrate the deposit refund system.
We would recommend one central system, potentially owned by various
stakeholders, such as industry groups, NGOs and retailers, which would operate to
meet the recycling targets specified by the Government and administrate the DRS
(see Recommendations 1 and 2). This is a similar system to the Scandinavian
approach. The exact nature of the central system would probably reflect the way in
which the DRS emerges (mandatory, or more voluntary in nature), with discussions
to be had about the amount of outsourcing of various functions that would need to
be undertaken.
Recommendation 4: PET bottles, glass bottles and aluminium and steel
cans should be covered by a UK-wide deposit refund system.
We recommend that the following beverage containers should be covered within a
UK-wide DRS:
• PET bottles
• Glass bottles
• Aluminium and steel cans
The option to include other plastic bottles should also be considered. The decision to
include beverage cartons, in light of technological developments being made, should
also be considered prior to full implementation of the scheme. In any case, as
suggested above, such containers should also be made the subject of high recycling
targets.
101
Although in this case, it seems likely that consumers would ‘internalise’ lost deposits in the price
of the beverage, more so than where the deposit can easily be recouped. This might, in turn, depress
demand for the beverage itself.

89
In order to meet the targets mentioned above (see Recommendation 2), we would
suggest that the level of the deposit (ultimately to be determined by the central
system) should be in the region of:
• 15p for containers ≤500ml; and
• 30p for containers >500ml.
These are the average values used in our modelling – it is recognised that schemes
may differentiate these by material.
Recommendation 5: In order to deal effectively with imported beverage
containers, the deposit refund scheme should operate in parallel with
kerbside recycling services and/or the deposit refund scheme should be
designed to accept containers from France and Ireland.
A large volume of containers crosses the border with France, and to some extent the
Republic of Ireland, as a result of private trade in alcoholic beverages. Neither
country has a deposit system.
We have examined both ‘parallel’ and ‘complementary’ systems in this report, with a
parallel scheme running alongside existing kerbside collections and a
complementary scheme replacing the provision for recycling certain materials at the
kerbside. We have noted that a parallel DRS may increase unclaimed deposits, but
that we expect matters to converge, with some extraction of deposit-bearing
containers from the kerbside recycling system. Given the minimal effect on financial
flows other than the unclaimed deposits, we think it would make sense to still
operate the kerbside recycling service. This enables those consumers who import
beverage containers which bear no deposit to still recycle their containers.
An alternative approach would be to design the system to accept containers with
European Article Number (EAN) codes from France and the Republic of Ireland to
overcome the problem. This would allow reverse vending machines to accept
containers which bear no deposit. Clearly, in these cases, no deposit would be
redeemed, but it seems important for the system to accept containers from abroad,
to ensure consumer confidence is not lost (and especially if the existence of the DRS
leads some local authorities to cease collecting the targeted beverages over the
medium- to long-term).
Recommendation 6: A timescale of introducing a deposit refund
scheme by 2015 should be considered.
Whether in setting recycling targets, or in the context of introducing a mandatory
scheme, UK Government should consider the time scales for the implementation of
a DRS. Four to five years appears to be an appropriate time to allow for
infrastructure development and communication with all stakeholders. In addition,
this would allow for some transitional issues to be considered. For example, local
authorities’ collection schemes will be affected by the implementation of a DRS. In

90
order to realise the financial benefits to authorities from the DRS’s operation, time
to consider contractual positions and service design would appear appropriate.
Recommendation 7: Further research into the disamenity of litter
should be commissioned by the Coalition Government.
The Coalition Government has set its sights on reducing litter, yet there is no UK-
based study, to our knowledge, that allows us to estimate the negative effects – the
disamenity – of litter. The costs of litter and street cleaning are now a major part of
local authorities’ waste management budgets. They also appear to be costs which
are spent in seeking to address an environmental issue which is consistently cited
by residents as being a priority. There is a need for more research to be undertaken
regarding the disamenity associated with littering, in order to strengthen the
evidence base for estimating the impacts upon litter of a DRS in the UK. Indeed,
given the Coalition Government’s determination to address litter, it would seem
appropriate to consider the economic benefits which might be derived from the
clean-up of litter, if only to understand the level of resource which should be
committed to addressing the matter.
91
APPENDICES

92
A.1.0 Review of Deposit Refund Systems
Table 7-1: Experience with Deposit Refund Schemes in Other Countries / States
Country
System
Year of Intro
Containers Covered
Capture
Rate*
Deposit
Redemption
Site
Driver
Reference
Austria
Law to make deposit
regulatory
1992
PET bottles (non-
refillables excluded)
30% PET
60% Cans
$0.40
Government
www.BottleBill.or
g
Belgium
Ecotaxes Act of
1993
Containers taxed $0.52 per
litre unless they have
deposit.
1993
Beer, soda and soft
drinks containers
$0.12 <50 cl
$0.24 >50 cl
Government
www.BottleBill.or
g
Croatia
Deposit-return plus
‘incentive fee’ to be paid by
producer if 50% refill isn’t
met (5% paid still, if target
is met).
2005
Glass, PET and metal
containers for beer, soft
drinks, water, wine and
spirits.
Government
EUROPEN Report
2007
102
Denmark
Packaging Law. All beer
and soft drinks must be
sold in refillable bottles.
Metal banned until 2002.
Regulatory deposit for
imported glass/plastic
containers. Ecotax also.
1989
(amended
1991)
Beer and soft drinks
containers. Deposits on
some wine and spirit
bottles dependent on
retailer.
99.5 % (beer
and soft
drinks
containers
only)
€0.13 Type A –
Cans, plastic and
glass bottles <0.5 l
€0.20 Type B –
Plastic bottles @0.5
l
€0.40 Type C –
Cans, plastic and
glass bottles >0.5 l
Government
www.BottleBill.or
g Ernst & Young
2009
103
Estonia
Deposit-return
2004
Beer, low alcohol drinks,
carbonated/ non-
carbonated soft drinks,
water, juice, cider and
perry.
Glass 1.0 kroon
(refill and NRB)
Metal and PET < 0.5
l
0.5 kroons;
PET>0.5l 1kroon
Retailers
Government
EUROPEN Report
2007;
http://www.eesti
pandipakend.ee/
eng/epp/emblem
Finland
T
ax on beverage containers
Exemption from tax only if
1970s
(amended
One-way beer and soft
drink containers
Glass bottles
99%
Non-refillables:
€0.15 cans
8,000 sites
Government
http://www.palpa
.fi/retail-
102
EUROPEN (2007) Economic Instruments in Packaging and Packaging Waste Policy, Brussels: EUROPEN.
103
Ernst & Young (2009) Assessment of Results on the Reuse and Recycling of Packaging in Europe, report produced for the French Agency for
Environment and Energy Management (ADEME), March 2009.

93
Country
System
Year of Intro
Containers Covered
Capture
Rate*
Deposit
Redemption
Site
Driver
Reference
part of refillable deposit
scheme.
1990)
Cans 86% €0.10 plastic
bottles <0.35 l
€0.20 plastic
bottles 0.35-1 l
€0.40 plastic
bottles >1 l
Tax
$0.24 beer $0.47
plastic $0.71 glass
trade/recycling-
systems
Germany
Einwegpfand Deposit on
one-way a standard
amount, deposit on
refillables manufacturer
dependent, not legally
specified, though tend to
be similar.
2003
Not containers for wine,
fruit juice or spirits
Quota-
Glass 90%
Alu. 90%
Plastic 80%
For one-way:
≤1.5 l €0.25
>1.5 l €0.50
Manufacturer
Hungary
Tax linked to market share
quotas.
2005
Beer, low-alcohol drinks,
wine, mineral water,
carbonated and non-
carbonated soft drinks.
Quota-
Beer 67%
Low alcohol
28% Wine
20%
Iceland
Tax on non-refillable
containers.
2008
Non-refillable glass,
steel, aluminium and
plastic.
Kiribati
Special Fund Act 2004
2004
Aluminium cans and PET
drinks bottles
$0.05 ($0.04
returned)
Kaoki Mange
operating
centres.
www.BottleBill.or
g
Malta
Deposit Return
System
Previous ban of non-glass
beverage containers, lifted
Mexico
Higher tax on non-refillable
bottles and cans.
Fed. States of
Micronesia
Kosrae Recycling
Program
(Deposit-return)
1991
(amended
2006)
Currently only aluminium
cans, but glass and
plastic expected to be
added soon.
20,000 cans
per day
$0.06 ($0.05 back)
Kosrae Island
Resource
Management
Authority
(KIRMA) sites
www.BottleBill.or
g
Netherlands
Agreement deposit
1993
Soft drinks and water in
one-way and refillable
glass and PET containers
Refillable
glass 98%
Refillable
PET and glass:
$0.16 <0.5 l
$0.72>0.5 l
Industry
www.BottleBill.or
g

94
Country
System
Year of Intro
Containers Covered
Capture
Rate*
Deposit
Redemption
Site
Driver
Reference
PET 99%
Norway
Deposit on containers and
tax dependent on return
rate.
Refillables only exempt if
95% return rate is
achieved. Retailers (on site
>25m²) selling non-
refillables, must also sell
similar products in
refillable.
1994
Most drinks excluding
milk, vegetable juices
and water
Wine/ spirits
60%
Beer 98%
Soft drinks
98%
$0.16 <0.5 l
$0.40 >0.5 l (+Tax
inversely
proportional to
return rate, but if
above 95%, no tax)
Over 9000
establishments
in the country,
plus 3000
deposit
machines
where receipt is
given
Tax is
government
driven, but
recycling fee in
place is retailer
driven
http://www.resirk
.no/Introduction-
64.aspx
Peru
Deposit on some bottles
620ml size beer bottles
Portugal
Fillers must ensure quotas
met
Retailers must sell
refillables for all non-
refillables sold.
Quotas-
Beer 80%
Wine (with certain
exceptions) 65% Soft
drinks 30%
South Africa
Deposit return system,
voluntary i.e. manufacturer
driven, not Government.
Around 1948
Approx. 75% beer, 45%
soft drinks and some
wine and spirits bottles
Between 8-15% of
product cost
(or 0.5-1% if
wine/spirit)
Manufacturer
Spain
Return
overall 87%
Reuse beer
57%
http://www.cerve
ceros.org/
Sweden
Law requires rate of 90%
recycling of aluminium
cans, or complete ban.
Industry implemented
deposit system to avoid
this. PET introduced later
as well.
deposit
Deposit on
one-way
containers-
1984 for
cans.
1994 for PET
(refillables
already in
place)
Aluminium cans and PET
law. Deposit now on
most beverage
containers.
Recovery
rate of 80-
90% on one
way
containers
Voluntary Cans
$0.07
Refillable PET $0.56
One-way PET $0.14-
0.24
Law
government
driven.
Standard bottle
and deposit
brewer/bottler
driven.
www.BottleBill.or
g; Ernst & Young
(2009)
103
Switzerland
Deposits required on all
refillable drinks containers
except cans, which have a
voluntary tax of $0.04.
1990
All above a certain
weight (currently all!)
Refillable
glass 95-
98%
Refillable
PET 70%
Ref. glass
$0.16<0.6 l
$0.40 >0.6 l
Ref and one-way
PET $0.40>1.5 l
Government
www.BottleBill.or
g

95
Country
System
Year of Intro
Containers Covered
Capture
Rate*
Deposit
Redemption
Site
Driver
Reference
South Australia
Container Deposit
Legislation- deposit
required on almost all
drinks containers, with
onus on manufacturer/
wholesaler to ensure
convenient system in place
for deposit of container/
refunds for customers.
1975
(integrated
into
Environment
Protection
Act in 1993)
Most included except
wine (unless in plastic
bottle), milk, pure fruit
juice or flavoured milk
>1l.
85% non-
refillable
glass
84% cans
74% PET
$0.10 if refillable to
retailer (rare) $0.05
if refillable to
collection depot
(99.9% done this
way)
Mostly
collection
depots, though
some store
refillables.
Government
legislation with
manufacturer/
wholesaler
responsibility
www.BottleBill.or
g
Canada- Alberta
All containers sold in
Alberta (including imports)
must be registered through
the Beverage Container
Management Board
(BCMB).
1972
All beverage containers
regulatory except milk,
which is under a
voluntary scheme
Glass (AB
Beer) 96%
Glass (import
beer) 92%
Alu (beer)
89%
Alu (soft)
79%
Overall 78%
$0.05 <1 l
$0.20 >1 l Beer
$0.10
215
independent
depots and 78
retail outlets
(for beer
bottles and
cans only)
Initially
government,
until 1997
when it was
turned over to
private sector
www.BottleBill.or
g
Canada- British
Columbia
All containers must be
refillable, and none
collected can be landfilled
or incinerated.
Beer separate system,
though still under
legislation.
1970
All beverage containers
except milk, soya milk,
infant formulas, dietary
or meal supplements, or
other milk substitutes.
81.3%
Non-alcoholic $0.05
<1 l
$0.10> 1 l
Alcoholic (not incl.
beer)
$0.10 < 1 l
$0.20 >1 l Beer
$1.2 per dozen
Depots or
retailers (all
retailers
obliged to take
back as much
as they sell).
Beer back to
retailer.
Industry
www.BottleBill.or
g
Canada-
Manitoba
Beverage producers given
option of setting up
deposit-return system, or
adding a 2 cent per
container levy. Only beer
producers choose the
former.
1995
Beer containers only
Refillable
beer 95.5%
Dom beer
74%
Glass 34%
Overall
residential
31%
$0.10
Retailer
Opportunity
government
driven,
implementati-
on producer
driven
www.BottleBill.or
g
Canada- New
Brunswick
Deposits paid on all
containers (bar milk), but
1992
(revised
All except milk
Refillable
beer 96%
<0.5 l $0.10
>0.5 l $0.20
89 depots
around the
Industry
www.BottleBill.or
g; Encorp Atlantic

96
Country
System
Year of Intro
Containers Covered
Capture
Rate*
Deposit
Redemption
Site
Driver
Reference
whilst full paid back on
refillables, only half paid
back on non-refillables.
1999)
Dom beer
75%
Non-alcoholic
75%
province.
Inc
(unpublished)
104
Canada-
Newfoundland
Half-back system, with
manufacturers prohibited
from selling containers
other than recyclable or
refillable for selected
products. Beer operated
separately, run by brewers.
Only have to refund when
customer buying (1 for 1),
otherwise negotiable.
1997
Beverage containers
smaller than 5l,
excluding milk, dietary
supplements and
medicine.
Refillable
beer 95%
Domestic
beer 55%
Non-alcoholic $0.08
($0.04 back)
Alcoholic (excluding
beer) $0.20
($0.10 back)
Beer varies -full
refund when same
number of beer
bought as empties
returned.
‘Green Depots’
run as
businesses.
Beer returned
to certain retail
outlets.
Government,
but brewers for
beer system.
www.BottleBill.or
g
Canada-
Northwest
Territory
Deposit-return system, with
additional handling
charges for different
products/ materials in
container.
2005
All beverage containers
except milk.
Very new
system, so
no certain
figures yet.
Approx. 72%
Wine or spirit $0.25
Other $0.10
Plus additional
$0.05-0.10 handling
fee
18 government
depots or 26
community
depots.
www.BottleBill.or
g
Canada- Nova
Scotia
Half-back deposit system.
Full refund on refillables,
half on non-refillables.
All beverage containers
except milk.
Refillable
beer 96%
Dom. beer
70%
Non-alcoholic $0.10
Alc. refillable
<1 l $0.10
>1 l $0.20
Alc. non-refillable
<0.5 l $0.10 >0.5 l
$0.20
83 province-
wide depots.
RRFB-Resource
Recovery Fund
Board
Government
and industry.
www.BottleBill.or
g
Canada- Ontario
Deposit-return system on
alcoholic drinks containers
only.
Use of ‘Industry Standard
Bottle’.
Alcoholic drinks
containers
Refillable
‘industry
standard
bottles’ beer
97%
Containers up to
630 ml, or metal
containers up to 1 l
$0.10 Over those
sizes $0.20
Beer store only
Brewers
www.BottleBill.or
g
Canada- Prince
Edward Island
Non-refillable drinks
containers for beer or soft
drinks banned since 1977.
1977 ban,
1984 deposit
Soft drinks and alcoholic
drinks. Wine may be
included.
Refillable
beer 96%
Wine/ spirit
Non-al
<0.5 l $0.15
0.5 l-1 l $0.30
Mainly retailers
(inc.
supermarkets
www.BottleBill.or
g
104
ENCORP Atlantic Ltd (unpublished), Accounting for Success: EnSys – A Materials Management System to Support the Recovery of Used Beverage
Containers in the Province of New Brunswick, May 2008.

97
Country
System
Year of Intro
Containers Covered
Capture
Rate*
Deposit
Redemption
Site
Driver
Reference
Wine may have half-back
system in place.
59%
Soft 98%
>1 l $0.70 Alc.
$1.20 per dozen, or
).07 each
and
convenience
stores), also 15
depots
Canada- Quebec
Return-to-retail deposit
system, with industry
required to fund kerbside
collection for containers
not part of the system.
All beer and soft drinks
containers (not juice,
water and iced tea)
Refillable
beer 98%
Dom. beer
76%
Soft drinks and beer
cans
$0.05
Beer bottles $0.10
Beer bottles and
soft drinks >450ml
$0.20
Retailers
(including
depanneurs -
small
convenience
stores not
usually
included in
Canada).
www.BottleBill.or
g
Canada-
Saskatchewan
Deposit-return system plus
environmental handling
charge (EHC) for non-
refillable containers, for
recycling, and beer bottle
deposit system for
refillables.
1973- Litter
Control
Regulations
(unclear,
appears the
deposit
system
introduced to
this in 1998)
All beverage containers
apart from milk (under
voluntary system).
Refillable
beer 92%
Dom. beer
cans 95%
Alu. cans
95%
Glass 83%
Overall 86%
Deposits vary widely
for diff. materials
and sizes
Non-ref. glass
$0.40-1.00
Metal cans
$0.10-0.20
Beer bottles
can only
receive full
refund if
returned to 10
specific sites,
but can be
returned for
less at retailers.
Other returns at
71 SARCON
site
Government
www.BottleBill.or
g
http://www.sarcs
arcan.ca/sarcan/
faqs.php
Canada-Yukon
No kerbside collection.
Deposit-return system, with
‘recycling club’ for children
offering ‘prizes’ as well as
refund if certain numbers
reached. Refillables not
charged recycling fund fee,
all others are.
1998
All beverage containers
except milk.
Refillable
bottles 103%
Non-refill.
bottles 113%
(?)
Liquor
containers
<200ml 99%
1L 90%
>1L 79%
(includes
refillables)
D=deposit,
R=refund
Liquor ref. D=$0.10
R=$0.10
Liquor non
<0.5 l D=$0.15
R=$0.10
>0.5 l D=$0.35
R=$0.25
22 depots or
four Liquor
Commission
outlets
Government
www.BottleBill.or
g
USA-California
California Beverage
Container Recycling and
Litter Reduction Act
1987
(Expanded
2000 to
Non-refillable drinks
containers, inc. beer,
spirits, carbonated, fruit
Alu 73%
Glass 58%
PET 46%
Under 24oz $0.05
Over 24oz $0.10
Redemption
centres (not
retailers)
www.BottleBill.or
g

98
Country
System
Year of Intro
Containers Covered
Capture
Rate*
Deposit
Redemption
Site
Driver
Reference
Deposit-return system on
non-refillable containers
include all
non-
carbonated
and non-
alcoholic
drinks
excluding
milk.)
drinks and some
vegetable juices. Not
milk.
HDPE 51%
Overall 61%
USA-Connecticut
Beverage Container
Deposit and Redemption
Law
Deposit-return system.
1980
Beer, malt, soft drinks
and mineral water.
Not recorded.
In 2004 CRI
estimated
recycling rate
to be similar
to
Massachuset
ts of 69%
$0.05
Redemption
centres, or
retailers (but
only for brands
/products they
sell).
www.BottleBill.or
g
http://www.cga.c
t.gov/2005/rpt/2
005-R-0836.htm
USA- Delaware
Beverage Container
Legislation
Deposit-return system
1982
Wholesale
1983 Retail
All non-aluminium beer,
malt, carbonated,
mineral water and soda
water containers less
than 2 quarts (approx.
1.9l).
Not recorded. $0.05
Retail stores,
but only for
brands they
sell.
www.BottleBill.or
g
USA-Hawaii
Deposit Beverage
Container Law Deposit-
return system
2002
All beverage containers
excluding milk and dairy
derived products, except
tea and coffee or liquor
containers.
72% for
2008
$0.05
Redemption
centres or
retailers (if not
within 2miles
of red. centre in
highly pop.
areas, or if
under 5,000sq
ft of retail
space
Government
www.BottleBill.or
g
USA-Iowa
Beverage Container
Deposit Law
Deposit-return system.
Deposit containers banned
from landfill in 1990.
1979
Beer, soft drinks, soda
water, mineral water,
wine, liquor and wine
coolers.
93% Not less than $0.05
Redemption
centres or
retailers (who
can refuse if
they have an
agreement with
former).
www.BottleBill.or
g
USA- Maine
Refillable Beverage 1978
Beer, soft drink, wine Not recorded. Wine and liquor Redemption
www.BottleBill.or

99
Country
System
Year of Intro
Containers Covered
Capture
Rate*
Deposit
Redemption
Site
Driver
Reference
Maine
Container Law Deposit-
return system
cooler, mineral water.
Expanded to include
wine, liquor, water and
non-alcoholic drinks in
1989.
$0.15 Other $0.05
centres or
retailers (who
can refuse if
they have an
agreement with
former).
g
USA-
Massachusetts
Beverage Container
Recovery Law
Deposit-return system
1983
Beer, soft drinks and
carbonated water.
69% $0.05
Any retail
establishment
that sells the
container.
www.BottleBill.or
g
USA- Michigan
Michigan Beverage
Container Act
Deposit-return system
1978
Beer, soft drinks,
carbonated and mineral
water. Wine coolers and
canned cocktails in
1988.
97% $0.10
Retail stores
wwiw.BottleBill.or
g
USA- New York
New York State Refillable
Container Law
Deposit-return system
1983
Beer and other malt
drinks, carbonated soft
drinks, wine coolers,
mineral and soda
waters.
Soft drink
62%
Beer 77%
Wine coolers
65% Overall
70%
Minimum of $0.05
Retail stores
and
redemption
centres.
www.BottleBill.or
g
USA- Oregon
The Beverage Container
Act
Deposit-return system
Only US deposit law with no
handling fee.
1972
Beer, malt, carbonated
soft drinks, mineral and
soda water and (as of
2009) water and
flavoured water. Bottles
and cans under 3L
Overall 84%
Standardized refill
bottles $0.02
Non-standardized
and non-refillable
$0.05
Retail stores.
www.BottleBill.or
g
USA- Vermont
Beverage Container Law
Deposit-return system
1973
Beer, soft drinks, malt,
soda and mineral water,
mixed wine and liquor
(added 1987).
Overall 90-
95%
Liquor above 50ml
$0.15
Other $0.05
Retail stores
and
redemption
centres.
www.BottleBill.or
g
Source: data based on report by Oakdene Hollins (2008) Refillable Glass Beverage Container Systems in the UK, Report for WRAP, 26 June 2008.
*The report notes that capture rate includes containers returned for recycling as well as refilling. Separate figures were not so readily available. Unless
specifically listed as something else, the monetary unit is American dollars. The only exception is Canada where the Canadian dollar is used.
Percentages given for US capture rates are taken from various sources, often telephone conversations by the Bottle Bill researchers. For more detailed
references see www.BottleBill.org

100
A.2.0 Cost Benefit Analysis Model
The cost benefit analysis (CBA) model has been developed by Eunomia as a bespoke
model that also utilises Eunomia’s existing municipal waste collection model,
Hermes.
105
The overall structure of the model is given in Figure A-7-1.The key elements are:
1) A waste baseline for each of the key materials, which will include modelling of
kerbside collection of household waste;
2) Scenario waste flow modelling;
3) Deposit refund (DR) system modelling;
4) Environmental impacts of recycling and disposal (including the disamenity of
litter); and
5) Final results calculations.
The remainder of this section first provides details on the materials that we have
included in scope for the deposit refund system, as these will form the focus of the
mass flow modelling. It then examines the waste mass flow assumptions used in
order to model the baseline, followed by the key changes that are subsequently
made to the waste mass flows as a result of introducing a deposit refund model in
the UK.
105
Hermes has been used in projects for WRAP, Defra, Welsh Assembly Government, and by many
local authorities around the UK. It has also been used in developing shadow bids in procurement
processes for waste collection services.

101
Figure A-7-1: Cost Benefit Analysis Model Schematic
Mass Flow Baseline
Scenario Waste
Flows
Monetised
Envi ron ment al
Impacts (per tonne)
Costs – Bring/
Commercial/ Litter
(per tonne)
Deposit Refund Costs
Reduct ion in
tonnes arising
at kerbside
Costs and Benefits
Change in Tonnages

102
A.2.1 Materials to be Included in Deposit Refund System
The materials that we have included in the deposit refund system are one-way (non-
refillable) beverage containers as follows:
1) Plastic bottles made from PET (Polyethylene Terepthalate) e.g. fizzy drinks,
mineral water, squash bottles. The recycling symbol on these products is:
2) Metal cans, both steel and aluminium e.g. fizzy soft drinks, beer cans, energy
drinks etc.
3) Glass beverage containers e.g. beer bottles, wine bottles, soft drink bottles etc.
Although there is, strictly speaking, no reason why, in theory, other containers or
packaging could not be collected in these systems, the model has been designed
around beverage containers for the following key reasons:
¾ Beverage containers are more likely than other types of food-based
containers to be consumed away from home and thus end up as litter;
106
¾ More investment in technology would be required in order to enable
recognition in reverse vending machines (RVMs)/counting centres for other
types and, importantly, shapes of containers/packaging;
¾ It enables industry-specific modelling, reducing the number of stakeholders
and facilitating easier management of the system; and
¾ Hygiene issues, in particular with regard to plastic milk bottles and other
food-based containers, have been given as a reason for not including high-
density polyethylene (HDPE) in existing deposit refund systems.
107
The modelled system targets non-refillable containers, because the market for
refillables in the UK is much smaller than that for non-refillables, and because a
deposit refund system would encourage the capture of non-refillables which are
purchased away from home as well as those consumed in the household. Some
deposit refund systems (DRSs) do remain in the UK, but they are the exception
rather than the rule, and target the smaller market of refillable glass bottles (e.g. A.
G. Barr scheme in Scotland, milk rounds across the UK), rather than the growing
market of disposable containers.
108
Targeting non-refillables exploits the potential
106
http://www.bottlebill.org/about/benefits/curbside.htm
107
ERM (2008) Review of Packaging Deposits System for the UK, Final Report produced for Defra,
December 2008.
108
See http://www.agbarr.co.uk/agbarr/newsite/ces_general.nsf/wpg/corporate_responsibility-
courtauld_commitment_2!OpenDocument

103
for increased recycling rates, a reduction in litter levels and an increase in the quality
of material that is collected for recycling through the deposit mechanism.
A.2.2 Baseline
The first step in building the cost benefit analysis model was to consider the
material flows in the UK, where the waste arises and how much of the waste is sent
for recycling compared to how much ends up requiring disposal. Figure A-7-2
indicates the possible material flows in our container universe (before the DR
System).
Figure A-7-2: Possible Container Material Flows (Pre-DRS)
The second step was to consider which year to model as the baseline year. In this
study we have assumed the baseline year is around 2015; the landfill tax escalator
will have increased to £80 per tonne by 2014/15, and by this time, it is also likely
that fully comprehensive kerbside collection services will have been rolled out to all

104
households in the UK.
109
In order to provide direct comparison, the ensuing changes
to the baseline as a result of the introduction of a deposit refund system have also
been modelled based on the same year.
A.2.2.1 Household Kerbside Collection Modelling
Eunomia’s proprietary waste collection model, Hermes, has been used to investigate
the effect of implementing a deposit refund system in the UK on kerbside collection
schemes. Hermes is a sophisticated spreadsheet-based tool that allows a wide
range of authority specific and collection scheme specific variables to be modelled.
The optimisation of these variables allows us to build scenarios to accurately reflect
local circumstances. The main outputs of the model are recycling performance and
cost.
Eunomia is confident that Hermes is as reliable a tool as any of its kind. It has been
used to model systems for authorities that collectively manage around 25% of the
UK’s total municipal waste. It is used to support contract procurement advice and
contract dispute resolution by building ‘shadow’ bids against which contractors’
tender submissions can be tested. Hermes has also been used in the context of
studies of relevance to national policy, and to undertake a cost benefit analysis for
the kerbside collection of food waste across the UK.
110
The first step in building up a model of UK-wide kerbside collection schemes was to
develop a number of scenarios based on combinations of urban/rural classifications
and dry recycling collection systems currently employed across the UK. Classification
of local authorities across the United Kingdom into rural and urban varies from
nation to nation. For England, Wales and Northern Ireland, we were able to obtain
already-classified data on local authorities based on a broadly similar six-fold
classification as follows:
111,112,113
• Major Urban (districts with either 100,000 people or 50 percent of their
population in urban areas with a population of more than 750,000).
• Large Urban (districts with either 50,000 people or 50 percent of their
population in one of 17 urban areas with a population between 250,000 and
750,000).
109
Fully comprehensive means a system that would collect all of the containers in scope in this
study.
110
Eunomia (2007) Dealing with Food Waste in the UK, report for WRAP, March 2007
111
Defra (2008) Classification of Local Authority Districts and Unitary Authorities in England: An
Introductory Guide, Updated September 2008
http://www.defra.gov.uk/evidence/statistics/rural/documents/rural-defn/LAClassifications-
introguide.pdf
112
ONS (2005) Rural and Urban Area Definition for Middle Layer Super Output Areas, available at
http://www.ons.gov.uk/about-statistics/geography/products/area-classifications/rural-urban-
definition-and-la-classification/rural-urban-definition/index.html
113
NISRA (2005) Urban Rural Classification 2005, provided by NINIS, May 2010

105
• Other Urban (districts with fewer than 37,000 people or less than 26 percent
of their population in rural settlements and larger market towns).
• Significant Rural (districts with more than 37,000 people or more than 26
percent of their population in rural settlements and larger market towns).
• Rural-50 (districts with at least 50 percent but less than 80 percent of their
population in rural settlements and larger market towns).
• Rural-80 (districts with at least 80 percent of their population in rural
settlements and larger market towns).
For Scotland, the data available was not already classified on an overall local
authority basis; data was, however, available on the percentage of the population in
each local authority that can be found in each of six different urban/rural categories
given above.
114
We therefore used these percentages to classify each authority into
one of the six listed categories.
These classifications were then grouped to create a three-fold classification for all
authorities:
• Urban (Major Urban and Large Urban);
• Towns (Other Urban and Significant Rural); and
• Rural (Rural-50 and Rural-80).
In addition to the urban/rural classification, the number of households in each
district and the recycling collection scheme were collated for each district in the UK.
The dry recycling kerbside collection schemes were categorised into three types as
follows:
• Fortnightly single stream commingled (where the material is collected
unsorted and subsequently sorted at a Materials Recovery Facility (MRF)),
referred to as ‘Commingled’;
• Fortnightly two-stream (residents are asked to separate material into two
different collection containers, typically fibres in one (i.e. paper, card) and
containers in the other (i.e. cans, plastics, sometimes glass), with some
subsequent further separation required at a MRF), referred to as ‘Two-
stream’;
• Weekly sorting of materials at the kerbside, referred to as ‘Kerbside Sort’.
Alongside each of the dry recycling schemes, we modelled fortnightly residual waste
collections and weekly food waste collections (with the latter modelled as a being
collected on a separate vehicle for the commingled and two-stream systems, and as
being collected at the same time as the dry recyclables on the same vehicle in the
kerbside sort system). Garden waste collections were excluded from the analysis,
given that garden waste is typically collected in a separate pass and that the
114
Scottish Executive (2004) Urban Rural Classification 2003-2004, available at
http://www.scotland.gov.uk/Resource/Doc/47251/0028898.pdf

106
logistics for this waste stream would not subsequently be affected by any change in
beverage containers in the kerbside system.
This data was based primarily on our extensive knowledge of kerbside systems
across the United Kingdom, with any missing information provided by the Online
Recycling Information System (ORIS) sourced from WRAP.
115
The three rural/urban classifications were combined with the three collection
systems to create nine baseline categories. A summary of the number of authorities
in each of the nine categories, the average number of households and the average
population are provided in Table A-2, Table A-3 and Table A-4 respectively.
For the purposes of modelling in Hermes, the overall averages given in Table A-3 and
Table A-4 for the number of households and population were subsequently used for
the basic configuration of the three “districts” to be modelled, named Urban, Towns
and Rural. For each of these three districts, the three collection systems were then
modelled separately.
Table A-2: Number of Authorities in Our Nine Categories.
Urban Towns Rural Total
Commingled 60 48
47
155
Kerbside Sort 61 58
63
182
Two-Stream 29 23
14
66
Total 150 129
124
403
Table A-3: Average Number of Households in Each Authority for Each Category,
Rounded for Use in Modelling.
Urban Towns Rural Overall Average
Commingled 91,200
51,600
50,300
66,600
Kerbside Sort 79,500
51,800
46,900
59,400
Two-Stream 105,700
66,800
49,700
80,200
Overall Average 89,300
54,400
48,500
115
WRAP (2010) Recycling Information, Accessed May 2010.
http://www.wrap.org.uk/local_authorities/research_guidance/online_recycling_information_system
_oris/mapping.html

107
Table A-4: Average Population in Each Authority for Each Category, Rounded for Use
in Modelling.
Urban
Towns
Rural
Overall Average
Commingled 179,000
121,000
110,000
138,000
Kerbside Sort 185,000
115,000
113,000
136,000
Two-Stream 247,000
151,000
109,000
182,000
Overall Average 195,000
123,000
111,000
One of the most important inputs to the kerbside modelling is the quantity of
material collected for recycling. For this model, the tonnages were based upon the
WRAP report on kerbside recycling performance in England.
116
This report gives
recycling in kg per household per year for the six-fold rural/urban classification
above, as well as for the different recycling systems. The results for the six
rural/urban classifications were averaged in pairs to create three classifications.
The results printed in blue in Table A-5, Table A-6 and Table A-7 are the upper
quartile data for captures of the three materials (cans, glass and plastics) which
would be covered by the deposit refund system. We used the upper quartile because
we assume that recycling systems in 2015 would be performing better than the
median in 2007/8. Using a mathematical analysis technique (least squares
method), we were able to calculate the tonnage data for the nine scenarios given in
each table based on the data provided by WRAP.
Table A-5: Cans Dry Recycling Performance in kg/hhld/yr Calculated using Least
Squares from WRAP Kerbside Recycling Performance Data
Urban Towns Rural WRAP Data
Commingled 9.2 9.9
10.4
10
Kerbside Sort 12.2 12.8
13.4
13
Two-Stream 10.3 9.7
9.7
10
WRAP data 10.5 11
11.5
116
WRAP in association with Icaro Consulting (2009) Analysis of kerbside dry recycling performance
in England 2007/8, Summary report for WRAP, December 2009

108
Table A-6: Glass Dry Recycling Performance in kg/hhld/yr Calculated using Least
Squares from WRAP Kerbside Recycling Performance Data
Urban Towns Rural WRAP data
Commingled 49.4 53.2
58.4
54
Kerbside Sort 42.3 57.3
63.4
58
Two-Stream 45.5 43.6
45.1
45
WRAP Data 49.5 53
58
Table A-7: Plastic Dry Recycling Performance in kg/hhld/yr Calculated using Least
Squares from WRAP Kerbside Recycling Performance Data
Urban Towns Rural WRAP data
Commingled 11.8 12.2
12.2
12
Kerbside Sort 10.4 11.4
11.4
11
Two-Stream 10.4 9.9
9.7
10
WRAP Data 11 11.5
11.5
In addition the model also accounts for the tonnages of paper, card and food waste
being collected in the kerbside recycling systems; these were kept constant
throughout all modelling and therefore do not affect the results, but were simply
used to calibrate baseline performance based on known authorities.
In order to then drill down further into the actual tonnages of material that would
feed into the deposit refund model, we made the following additional assumptions
(in % by weight). These were based around detailed household compositions and our
knowledge of operational collection systems; furthermore they were validated when
outputs were sense checked against existing sources of packaging waste generation
and recycling, and found to be comparable:
¾ 75% of glass captured is beverage (as opposed to other) container glass;
¾ 50% of the plastic captured at the kerbside (mainly comprised of bottles) is
PET, with 50% being HDPE;
¾ 20% of cans are aluminium, most of which are beverage containers;
¾ 80% of cans are ferrous metals, with 30% of these being beverage
containers. The remaining ferrous cans being food containers, etc.
The total quantity of waste left in the residual stream is calculated as:

109
Other important assumptions for the Hermes modelling were the participation rate
(the percentage of households that participate in the recycling scheme at least once
every two weeks) and the set-out rate (the percentage of households that set out a
box in any given week, which will be less than the participation rate because not
everyone is setting out recyclables at every opportunity). For consistency across all
three types of collection scheme, both of these values were kept constant for all
options modelled, and were set at high-performing values of 85% and 72%
respectively for the dry recycling, and 100% and 90% for residual waste collection.
However, in reality, the set out and participation rates would be likely to be closer for
fortnightly commingled collections than for weekly kerbside sort.
A.2.2.2 Bring Sites / Household Waste Recycling Centres (HWRCs)
WasteDataFlow (WDF) was interrogated and data for all waste collection authorities
(WCAs) and Unitary authorities was compiled for the whole of the UK. The relevant
questions in WDF are:
The following assumptions, based upon the rationale described above, were
required to estimate the quantities of beverage containers currently being recycled
through these sources:
¾ All of ‘brown glass’ is beverage containers;
¾ All of ‘green glass’ is beverage containers;
¾ 35% of ‘clear glass’ is beverage containers (the remaining 65% is jars and a
small quantity of other clear glass such as broken pint glasses);
¾ 75% of ‘mixed glass’ is beverage containers;
¾ 50% of Plastics are PET beverage containers;
¾ 80% of mixed cans are ferrous metals / 20% are aluminium; and
¾ Commingled materials are disaggregated using the proportions of source
segregated materials captured for recycling.
See Table A-9 for estimates of the tonnages of beverage containers from bring sites
and HWRCs.
Waste in Refuse = Total Waste Collected at Kerbside
–
Waste Captured for
Question 16: Civic Amenity (CA) sites: Tonnes of material collected for
recycling/reuse at CA Sites operated by local authority or its contractors
Question 17: Bring sites: Tonnes of material collected for recycling/reuse at
bring sites operated by local authority or its contractors

110
A.2.2.3 Commercial Wastes
The definition of commercial wastes in this study includes all waste from non-
household sources. This includes beverage containers deposited in refuse or
recycling schemes from commercial or industrial enterprises.
Estimates of the total quantity of glass, dense plastics and metals in the commercial
waste stream for recycling or requiring disposal were taken from the recent landfill
bans cost benefit analysis.
117
Assumptions were then made to estimate the
proportion of beverage containers in each waste fraction, e.g. glass bottles in ‘glass.’
These estimates were then adjusted where required to ensure that a reasonable and
logical baseline was achieved.
See Table A-9 for estimates of the tonnages of beverage containers from
businesses.
A.2.2.4 On-the-Go Recycling and Street Sweepings
WasteDataFlow was interrogated and data for all waste collection authorities
(WCAs) and Unitary authorities for on-the-go recycling was compiled for the whole of
the UK. The relevant question in WDF is:
It should be noted that a caveat is included with the tonnages reported in WDF for
street recycling. There appeared to be large variations in the data reported between
authorities. Upon investigation, it was determined that the reporting of waste
collected in on-street recycling bins is not rigorous, and there are improvements to
be made in this area of reporting.
The same assumptions used for bring sites and HWRCs to estimate the quantity of
beverage containers captured for recycling (Appendix A.2.2.2) were also applied to
the tonnages reported for on-the-go recycling.
WDF was also interrogated to gather information on the total quantity of waste
collected from street sweepings for disposal (ie. litter that is collected from the
environment for disposal, at the expense of the taxpayer). This far outstrips the total
quantity of waste collected through on-the-go recycling bins. The relevant question is
given below:
The total quantity of street sweepings collected for disposal was disaggregated, on a
material basis, using the composition obtained by AEA Technology from the Welsh
117
Eunomia (2010) Landfill Bans Feasibility Research, Final Report for WRAP, March 2010,
http://www.wrap.org.uk/downloads/FINAL_Landfill_Bans_Feasibility_Research.f5cf24f9.8796.pdf
Question 34: Street recycling: Tonnes of material collected for recycling at street
recycling bins.
Question 23: Details of other wastes collected for disposal (residual waste not
collected for recycling) - Collected household waste: Street Cleaning

111
Assembly Government study.
118
Additional assumptions were required to estimate
the likely quantities of beverage containers in each waste fraction. These
assumptions are as follows:
¾ 75% of the 'Packaging glass' fraction are Glass Bottles;
¾ 50% of the 'Dense plastic bottles' fraction are PET Bottles ;
¾ 20% of the 'Ferrous food and beverage cans' fraction are Steel Beverage
Cans; and
¾ 60% of the ‘Non-ferrous food and beverage cans’ fraction are Aluminium
Beverage Cans.
119
See Table A-9 for estimates of the tonnages of beverage containers from on-the-go
recycling and street sweepings.
A.2.2.5 Total Products Placed on the Market / Total Waste Arisings / Containers
Remaining in Environment
In order to estimate the quantity of beverage containers left in the environment as
litter, we have combined a top down approach with the ‘bottom up’ approaches
considered in the Sections above. Our simple approach estimates that:
*note there will also be a small amount of re-use for other purposes (eg. home-brewing, plant pots, re-
using plastic bottles). The amount of re-use is unknown, but we would expect it to be relatively small
compared to the recycling and disposal figures used in this study.
The figure for ‘Total Containers Placed on Market’ is the top down approach,
calculated from known estimates for the total number of containers placed on the
market and the average weight of a container. Canadean® (beverage industry
information specialists) supplied us with data pertaining to the quantities of
different beverages, by container type, placed on the UK market in 2009.
The weights of beverage containers were determined through actual measurements
of sample products, from existing studies, and from websites such as The
Environmental Register of Packaging PYR Ltd.
120,121
The average weights for
different container types used in the study are given in Table A-21. This data allowed
118
AEA Technology, MEL Research, Waste Research and WRc (2003) The Composition of Municipal
Solid Waste in Wales, Report to the Welsh Assembly Government, December 2003
119
More food containers (soup tins etc) are made from ferrous metals, hence why the proportions of
beverage containers are higher for the non-ferrous fraction.
120
WRAP (2008) Bulk Shipping of Wine and its Implications for Product Quality, Final Report:
GlassRite: Wine, May 2008,
http://www.wrap.org.uk/downloads/Bulk_shipping_wine_quality_May_08.1be9881a.5386.pdf
121
PYR (n/a) Packaging Weight Units, Accessed 1
st
May 2010,
http://www.pyr.fi/eng/forms/packaging-date-questionaire/packaging-weight-units.html
Containers Remaining in the
Environment as Litter
Total Containers Placed on Market –
Containers Captured for Recycling and
Treatment / Disposal*
=

112
us to calculate the total weight of containers placed on the UK market every year. By
subtracting the tonnages of beverage container waste collected for recycling and
disposal from the total weight of containers placed on the UK market, the resultant
figure indicates the tonnage of beverage containers that would remain in the
environment as litter. The overall number and tonnages of containers placed on the
market and the amount of containers found in the environment are given in Table A-
9.
Table A-21: Average Weight per Container Type
Container Kgs
Soft/Beer & Cider Bottles 0.3
Wine bottles 0.5
PET Bottles 0.033
Ferrous Cans 0.035
Aluminium Cans 0.017
Source: Eunomia
The weight and number of containers predicted by our bottom up analysis was
greater than that estimated using the Canadean® data. This is due to the fact that
the Canadean data does not include imports from ‘private trade’ with other EU
countries (such as France and Ireland). The volume of beer, and wine, for example is
considered to be significant (see Section 6.6 for more detail).
A.2.2.6 Summary Baseline Figures
Table A-9 shows the mass flow baseline upon which subsequent calculations were
undertaken on the costs and benefits associated with the introduction of a deposit
system. Due to the high-level nature of this study, a full analysis of the ranges and
uncertainties in the modelling could not be accomplished. However, we believe the
estimates provided in Table A-9 to be reasonable, being, as they are, based on
reasoned argument, and rationalised to the greatest extent possible. Furthermore,
the tonnages were cross-checked with packaging data available from various
sources.
122,123
The figures were within acceptable error margins, especially when
considering data in the waste sector (often of low quality).
From the figures provided in Table A-9, it can be seen that:
¾ A significant quantity of containers will be sold in the UK every year (around
28 billion);
122
David Davies Associates (2009) PackFlow 2012: UK Compliance with the European Packaging &
Packaging Waste Directive, Volume 1: Summary Report & Recommendations, November 2009.
123
Advisory Committee on Packaging (2008) Packaging in Perspective, November 2008.

113
¾ The implied commercial recycling rate is high. Note, however, that the
baseline is modelled based on 2015, when the landfill tax has escalated to
£80 per tonne, which would promote the uptake of commercial recycling
services above and beyond the levels seen today; and
¾ A significant quantity of waste is left in the environment every year (~300
million bottles / cans etc). It is important to re-iterate the limitations of this
study in estimating the amount of beverage container litter that is present in
the environment. Unfortunately, we could find no studies or research that
have previously tried to estimate this figure with which to compare our
estimates. Our modelling does make an estimate of the potential disamenity
benefit possible from the removal of beverage container litter from the
environment.
The overall recovery rate for the containers in scope in this study, under the baseline
system (pre-DRS), is calculated at 68% (this is significantly higher than what is
currently being achieved, being based around a baseline where it is assumed that a
comprehensive set of kerbside recycling services has been rolled out across all local
authorities). There is, therefore, scope to increase the environmental benefits
associated with greater recovery of these materials.
A.2.3 Scenarios
This section describes the two central scenarios that have been modelled for the
introduction of a deposit refund system in the UK. These scenarios are as follows:
The scenarios result in changes in mass flow compared to the baseline described in
Appendix
A.2.2. To determine the magnitude of the change, we estimated the likely
situation following implementation of the DR system, and then calculated the
difference compared to the baseline.
Note that we have assumed the total quantity of containers placed on the market
remains constant across the scenarios. In reality the quantity may fall slightly as the
price of the container increases, though discussion with Canadean
®
suggests that an
increase in cost of 1-2p (ie. the admin charge calculated from the deposit refund
model) would be unlikely to instigate any significant changes in demand, with
demand being primarily driven by other factors such as the weather (determining
how thirsty we are) and promotional deals.
124
Demand is generally believed to be
relatively inelastic.
124
Personal communication with Canadean®.
1. Complementary – where no beverage containers are collected at the
kerbside i.e. the deposit refund system is complementary to the
existing kerbside schemes; and
2. Parallel – where the household kerbside systems for beverage
containers operate in parallel to the deposit refund system.
114
In both cases the mass flows were adjusted so that the overall return rate for the
deposit refund system was set at reasonable levels. The rationale for the likely
return rates follows.

115
Table A-9: Mass Flow Baseline for CBA Modelling
No. of
Containers
(millions)
Tonnages (thousand tonnes)
hhld Kerbside Bring HWRCs Commercial Litter Products
Placed on
Market
Placed
on
Market
Recycling
Refuse
Recycling
Recycling
Refuse
Recycling
Refuse
Recycling
Refuse Environment
Glass
Bottles
5,905 2,288
1,002
312
234
33
5
505
89
17
68 23
PET
Bottles
8,846 314
71
164
5
4
1
15
14
1
37 3
Cans
(Fe.)
5,717 200
45
84
7
3
0.1
31
8
2
18 2
Cans
(Al.)
7,271 124
34
46
2
1
0.1
10
3
0
26 1
Total 27,740 2,926
1,152
605
249
41
6
562
114
20
148 29

116
We start with the maximum return rate likely from a standalone system (scenario 1
– the ‘complementary’ system). Through looking at existing systems, it is estimated
that a likely return rate for all beverage containers would be 90%.
125,126,127,128
This
is by no means the maximum (or minimum) value, but likely to be a reasonable
estimate, especially if containers cannot be collected at the kerbside.
For the parallel system (scenario 2), consumers whose behaviour is not influenced
by the loss of deposits will continue to leave containers within the DR system in
kerbside boxes or in their residual waste bin. It could be argued that those for whom
the deposit is valuable might remove the containers from kerbside boxes and bins.
This could also include kerbside collection crews / MRF operators. However, the
capture via these methods will be unlikely to be as high as through the deposit
refund system itself. We therefore assume that the overall return rate for containers
in the system will be less than the ‘complementary’ scenario, and we estimate the
return rate might be 80% under the ‘parallel’ scenario.
The general approach to determining the waste flows for the two scenarios is given
in the sections below. This is followed by summary tables showing, in quantitative
terms, the effects of the two scenarios.
A.2.3.1 Scenario 1 (Complementary System) Waste Flow Principles
The general principles used to estimate the likely future waste flows as a result of a
complementary deposit refund system are:
¾ There is a 100% reduction in the quantity of beverage containers collected for
recycling through household kerbside collection systems;
¾ The quantity of containers in refuse will not be zero, as some people simply
will not take the containers back to a collection point. We have assumed 5%
of containers remain in household refuse (clearly this is an unknown factor,
no data supports this figures specifically. But if return rates of >90% are
possible, and some containers, of which the householder is the greatest
generator, are disposed of, 5% disposal in household refuse seems a
reasonable estimate. The main point being that this activity would occur so it
is important to make some estimation of if in the modelling work); and
¾ It is assumed that the same percentage reduction is applied to the number of
containers collected in each waste management route (other than at the
kerbside) in order to achieve an overall return rate in the deposit refund
system of 90%.
125
http://www.dansk-retursystem.dk/
126
http://www.palpa.fi/
127
http://www.resirk.no/Frontpage-63.aspx
128
Eunomia et al. (2009) International Review of Waste Management Policy: Annexes to Main
Report, Report for Department of the Environment, Heritage and Local Government, Ireland,
September 2009.
117
A.2.3.2 Scenario 2 (Parallel System) Waste Flow Principles
The general principles used to estimate the likely future waste flows as a result of a
parallel deposit refund system are:
¾ There is an 80% reduction in the quantity of beverage containers collected
through household kerbside collection systems
¾ It is assumed that the same percentage reduction is applied to the number of
containers collected in each waste management route (other than at the
kerbside) in order to achieve an overall return rate in the deposit refund
system of 80%.
In reality, it might be that there is a larger reduction in the number of containers
collected through particular waste management routes as opposed to others. For
instance, it would be easier for an individual to pick containers out of litter bins or
the environment than from bring banks or commercial waste routes. Hence it might
be expected that fewer beverage containers would be found in litter bins and the
environment than in bring banks or commercial waste routes. However, given the
lack of evidence to support this theory, we have modelled the same reduction in
beverage containers for each management route.
A.2.3.3 Summary Scenario Waste Flows
Table A-23 shows the change in waste mass flows as a result of the implementation
of a complementary or parallel deposit refund system in the UK.
As illustrated in Table A-23 the magnitude of the shift from existing collection routes
increases under the complementary scenario – this is due to the fact that the
possibility of collection from household kerbside collection schemes is removed.

118
Table A-23: Change in Mass Flows Resulting From Introduction of Complementary and Parallel Deposit Refund Systems
No. of
Containers
Tonnages (thousand tonnes)
hhld Kerbside
Bring
HWRCs
Commercial
Litter
Products
Placed on
Market
T
otal
Arisings
Recyclin
g
Refuse
Recyclin
g
Recyclin
g
Refuse
Recycling
Refuse
Recyclin
g
Refuse
Env.
via DR
System
Complementary Deposit System (Scenario 2)
Glass
Bottles
0 0
-805
-249
-183
-26 -4
-394
-69
-13
-53
-18 1,814
PET Bottles
0 0
-57
-146
-4
-3 -1
-12
-11
-1
-29
-2 265
Cans (Fe.)
0 0
-40
-74
-6
-2 0
-25
-6
-2
-14
-2 170
Cans (Al.)
0 0
-24
-39
-1
-1 0
-8
-3
0
-20
-1 98
Parallel Deposit System (Scenario 1)
Glass
Bottles
0 0
-1,002
-246
-192
-27 -4
-414
-73
-14
-56
-19 2,047
PET Bottles
0 0
-71
-152
-4
-3 -1
-12
-11
-1
-30
-3 288
Cans (Fe.)
0 0
-45
-77
-6
-2 0
-26
-6
-2
-15
-2 181
Cans (Al.)
0 0
-34
-42
-1
-1 0
-8
-3
0
-21
-1 112
119
A.3.0 The Deposit Refund System Model
The various stakeholders in an operating deposit refund system are:
¾ A government body authorising the system and associated finances, and
setting recycling targets for the various materials;
¾ A central organisation owned and run (within the constraints set by the
authorising body) by, for example, non-governmental organisations (NGOs),
industry bodies, producers, breweries and retailers;
¾ The manufacturers of containers, producers of beverages and industries that
‘fill’ the containers;
¾ Any retailer which sell beverages in the UK;
¾ All consumers which purchase beverages in the UK; and
¾ Businesses and organisations involved with the collection, sorting and
reprocessing of waste containers.
Various stakeholders are involved in the material flows of beverages (pre and post-
consumption), deposit payments, other finances and sales or container return data.
An overview of the key elements, material and finance flows, in the UK’s deposit
refund system model developed for this study is given in Figure A-7-3.
The system developed for this study is based on similar principles (though the
details reflect the UK’s structure of retailing) to the systems which exist in Denmark
(Dansk Retursystem) the Scandinavian countries (Norsk Resirk, Returpack and
Palpa), and in a number of provinces within Canada (ENCORP Atlantic Ltd, ENCORP
Pacific Inc). The operation of the system is described in the following points:
¾ As beverages are produced and sold to wholesalers, or directly to retailers,
producers send sales data to a central system along with a payment
matching the total value of the deposits on all items sold. The cost of the
deposits is then paid back to the producers, by wholesalers or retailers, upon
sale. The same happens as wholesalers sell items to retailers. Producers also
pay an administration fee to cover the remaining costs of the system. This is
set each year to reflect market prices of recyclate, amongst other factors;
¾ When the consumer purchases a beverage they pay the deposit to the
retailer, so the retailers are also reimbursed the total value of deposits;
¾ As consumers return empty containers to stores (or any other take-back
centre) the deposit is paid to them by the retailer. This puts the retailer out of
pocket, so they send return data to the central system, which reimburses the
retailer once more. Thus the circle of deposit payments is closed. As the
return rate for containers in not 100% the central system will not need to
reimburse the retailers the full amount of deposits, so money will remain with
the organisation to fund its operation.
¾ In addition to the deposit, the central system pays a handling fee to the
retailer for each returned container, the intention being to compensate the

120
retailer for loss of space (storage requirements) and time (in processing the
deposit and taking back the containers). Handling fees are reviewed and
adjusted each year;
¾ Returned empty containers are collected in a number of ways. Automated
systems of collection use reverse vending machines or automated counting
machines. Manual collection is also possible. in this instance the retailer
accepts the container, over the counter, and stores it in bags or crates at the
back of the store/outlet for transport;
129
¾ Where the containers are collected via an automated machine, the sorted
(and predominantly compacted) material can be transported directly to a
recycler, with material revenues being paid back into the central system.
Material revenues will also be paid on those containers that are collected
manually, though this material will first have to be transported to a dedicated
centre for counting, sorting and compacting, before it can be hauled on to a
recycling facility. These costs are met by the central system;
¾ The central system is the focal point for the flow of information regarding
container sales and finance for the whole deposit refund system. A significant
one-off cost will be required to initially set up the deposit refund system,
including all the necessary administrative support, which we have modeled
as being met by ‘one-off’ producer and retailer joining fees. There will also be
on-going costs associated with administering the system which are covered
as part of the producer administration fee paid on each unit that is placed on
the market. The overall administration fee payable by the producers/
importers is calculated as the balance of income from material revenues and
unclaimed deposits against the costs of collection, transport, processing,
admin and handling fees. In other words, the administration fee guarantees
the DRS is ‘cost neutral’ overall.
129
This differs to the typical systems employed in countries such as Sweden and Canada, where
collections occur at a small number of redemption centres rather than at every retail outlet. We
believe that in order to maximize return rates and to remove the need for consumers to travel
individually make their way to redemption centres to return their containers, a denser network of
collection points would be more appropriate for the UK, and would eliminate additional
environmental impacts which might arise from making ‘dedicated journeys’ to redemption centres.
Thus we have modeled the system based on a high number of collection points via both automated
and manual methods of collection, similar to systems used in Norway and Denmark.

121
Figure A-7-3: Deposit Refund System Model

122
It is worth noting that the system modeled here differs to that which exists in
Germany, where the organisation that manages the deposit refund scheme, the
DPG, only has an ‘over-seeing’ role; the system in Germany is much less centralised,
with retailers able to set up their own systems of collection and processing, and
payments moving directly between the producer and retailer, rather than going
through a central system.
130
Given the array of problems that have been highlighted
in association with the German system, that this system has been recognised as an
expensive scheme and that the scheme was originally partly set up to try to
encourage the refillables market, we chose to model the UK system based on the
central model, seeking to learn from experiences that have been highlighted in the
operation of the German system, and indeed, others.
131,132
It is also worth noting
the recent communication from the European Commission, which states that:
“In practice, this means that Member States are allowed to introduce
mandatory deposit systems if, on the basis of an individual Member State’s
discretion, this is considered necessary for environmental reasons.”
133
The communication goes on to state several safeguards that need to be respected
in relation to how the system is designed in order to ensure a fair, open and
transparent system, including:
4) A countrywide system (which could be run either via a non-government
organisation (NGO), a government body or via the producers/distributors
concerned, and which may consist of more than one system operator so long as
the systems are compatible with each other). This will:
A) Ensure a sufficient number of return points for consumers to encourage
participation in the system.
B) Avoid ‘island solutions’ – a retailer-owned patchwork of different return
systems which are not compatible and which often force additional costs on
suppliers to adapt packaging to the requirements of the specific retailer.
5) A system which is open to all economic participators in the sector concerned –
including imported products under non-discriminatory conditions. This will avoid
creating an unjustified barrier to trade or distorting competition.
6) A system which ensures that there is no discrimination between those products
that are exempt and those that are subject to a deposit and that any
differentiation is based on objective criteria i.e. in principle, focus on material
130
Ernst & Young (2009) Assessment of Results on the Reuse and Recycling of Packaging in Europe,
report produced for the French Agency for Environment and Energy Management (ADEME), March
2009.
131
Perchards (2007) Study on Factual Implementation of a Nationwide Take-back System in
Germany After 1 May 2006, Final Report, 14 February 2007.
132
G. Bevington (2008) A Deposit and Refund Scheme in Ireland, Report commissioned by Repak
Ltd., September 2008.
133
EC (2009), Communication from the Commission: Beverage Packaging, Deposit Systems and
Free Movement of Goods, May 2009

123
and not on content of beverages as it is the former which drives the
environmental performance of the system.
In order to ensure in our modeling that a sufficient number of return points are
subsequently available to consumers in the UK system, we have modeled the
system as requiring a collection point at virtually all retail outlets that sell beverage
containers. In order to try to give the retailer a choice as to how returned containers
are subsequently collected, and to make the return easier for larger stores to which
most containers would most likely be returned, we have also modeled each retail
outlet as using either an automated system of collection (e.g. reverse vending
machine or automated counting centre) or a manual collection, where the retailer
takes back the container over the counter and stores the containers in bags/crates
at the back of the store/outlet for transport. This differs from the typical systems
employed in countries such as Sweden and Canada, where collections occur at a
small number of redemption centres rather than at every retail outlet. We believe
that in order to maximise return rates, to remove the need for consumers to travel
individually to redemption centres to return containers, and to reduce litter caused
by the disposal of containers whilst ‘on the go’, a denser network of collection points
would be more appropriate for the UK. Thus we have modeled the system based on
a high number of collection points via both automated and manual methods of
collection, similar to systems used in Norway and Denmark.
Further details of the modeling assumptions used for the collection, transport and
processing logistics are given in Appendix A.3.2.
A.3.1 The Deposit and Return Rates
The value of the deposit for the UK is calculated based on deposits and return rates
from other systems around the world. Figure A-7-4 shows the return rate as a
function of the deposit. The deposit is converted from the local currency of the
deposit refund system to GB Pounds (GBP) using OECD Purchasing Power Parities
from 2008.
134
This gives a better estimate of the value of the deposit than simply
using the current exchange rate.
The following best fit line was calculated for the data shown:
Return Rate = 0.0592 * Ln( deposit ) + 0.9876
In order to get a return rate of 90% for the UK, we set our deposit to be £0.20 (in line
with the relationship represented by this equation).
134
OECD (2010) Purchasing Power Parities (PPP), Accessed May 2010,
http://www.oecd.org/department/0,3355,en_2649_34357_1_1_1_1_1,00.html

124
Figure A-7-4: Return Rates as a Function of Deposits in PPP-Adjusted GB Pounds.
y = 0.0529Ln(x) + 0.9876
40%
50%
60%
70%
80%
90%
100%
110%
0.00 0.05 0.10 0.15 0.20 0.25 0.30
Deposit in PPP adjusted GBP
Return Rate
Denmark Norway Finland USA Israel Australia Log. (All)
Smaller containers generally have a smaller deposit than larger containers, so in line
with other countries, we have set a threshold at 500ml. UK market research shows
that approximately 65% of potential deposit refund containers sold have a volume
less than or equal to 500ml, while 35% have a volume greater than 500ml.
135
Using
this split, we set the deposit at £0.15 for small containers and £0.30 for large
containers (see Table A-24).
Table A-24: Proposed Deposits for Containers in UK Deposit Refund System
Container size % of UK market
Deposit
≤ 500ml
65%
£0.15
> 500ml 35%
£0.30
Overall
£0.20
135
Personal communication with Canadean®, May 2010, http://www.canadean.com/

125
A.3.2 Handling, Collection, Logistics, and Processing
The costs of handling the containers at retail outlets are borne by the retailers
themselves, and the costs of transport and collection by the central system. This
Section outlines the determination of these costs.
A handling fee is included in deposit refund systems to compensate the retail
industry for the additional cost realised through having to handle returned beverage
containers. In the current economic climate, many retailers would be opposed to an
additional uncompensated cost on their business. The handling costs were
calculated based upon realistic assumptions. The approach was mindful of how the
system would operate in the UK and what costs retailers were likely to incur. We
were careful not to be optimistic in the setting of assumptions, so therefore believe
the collection, handling and processing costs to be a good estimate of what they
would be in practice.
In determining the handling fee, the key considerations centre on the collection of
returned beverage containers i.e. where are the containers returned to, and how are
they transferred back to the retailer during the redemption of the deposit? Both
these aspects clearly affect the nature of the collection logistics required. It is
therefore important to understand first the retail landscape prior to determining the
system specification. This is described in the first of the sections below, along with
the outline design of the container take back and collection system.
Interestingly in other systems the handling fee is not directly linked to the costs
incurred by businesses.
136
The handling fee appears to be negotiated on an annual
basis. However, for this study it was felt appropriate to base the initial handling fee
on some rational considerations of the costs incurred. Moreover, calculating the
handling fees in this way enables their more straightforward inclusion in the cost
benefit analysis.
It is important to note that the deposit system in the UK will be different from those
in other countries because:
a) There are very few deposit systems left operating in the UK (especially for
alcoholic beverages, beer bottles etc), so most containers are one-way and will
be eligible for inclusion in the system;
b) Modern behavioural attitudes appear to place a premium on waste collection
activities which make minimal demands on personal time - thus drop-off ought
to be quick and locations easily accessible;
c) There is a relatively high population density; and
d) The historic nature of retail outlets has led to a structure which is essentially
characterised by large numbers of small outlets operating in a decentralised
manner (clearly many have now been replaced by larger supermarkets, but a
considerable number remain).
136
Personal communications with TOMRA, May 2010

126
All of these points mean that the system must have the ability to collect 1) large
quantities of glass, especially from pubs and bars; 2) a high proportion of containers
from a large number of dispersed outlets, and on a frequent basis; and 3) ensure
that take back is possible through easily accessible locations, thereby increasing the
likelihood of return.
Following establishment of the retail landscape, the handling fee was calculated by
ensuring the following elements were included in the cost calculations:
¾ RVMs (reverse vending machines);
¾ Retail Space Infringements;
¾ Labour;
• Pickup / Unloading;
• Take Back; and
¾ Bags and crates for containment.
These elements are costed in the sections below.
Following this, the determination of logistics and processing costs, financed by the
central system, are provided.
Finally the elements of the handling fee are brought together and the per unit fee
calculated.
A.3.2.1 Retail Landscape and System Design
In order to determine the types and total numbers of retail outlets in the UK that
might accept returned containers, data was amalgamated from numerous
sources.
137,138,139,140,141,142,143
It is estimated that there are over 350,000 outlets
137
Wetherill, Paul (2009) UK Business: Activity, Size and Location – 2009, An Office for National
Statistics Publication, September 2009,
http://www.statistics.gov.uk/downloads/theme_commerce/PA1003_2009/UK_Business_2009.pdf
138
Prosser, Londsay (editor) (2009) UK Standard Industrial Classification of Economic Activities 2007
(SIC 2007), An Office for National Statistics Publication, December 2009,
http://www.statistics.gov.uk/methods_quality/sic/downloads/SIC2007explanatorynotes.pdf
139
Defra Surveys, Statistics and Food Economics Division (2007) Food Service and Eating Out: An
Economic Survey, January 2007,
https://statistics.defra.gov.uk/esg/reports/Food%20service%20paper%20Jan%202007.pdf
140
NCBS (2005) Chapter 2: The UK food and drink industry, in Ethical trading in the UK food and drink
industry, a final report for Defra, August 2005,
https://statistics.defra.gov.uk/esg/reports/Ethical%20trading/chapter2.pdf
141
Frewin, Angela (2010) Number of Hospitality and Catering outlets – Industry Data, Accessed May
2010, http://www.caterersearch.com/Articles/2010/05/07/317292/number-of-hospitality-and-
catering-outlets-industry-data.htm
142
Institute of Grocery Distribution (2009) UK Grocery Retailing, Accessed May 2010,
http://www.igd.com/index.asp?id=1&fid=1&sid=7&tid=26&cid=94

127
currently operating in the UK that are likely to sell beverages (excluding kiosks).
144
The types of retail outlet considered were:
¾ Superstores;
¾ Medium Stores (including cash and carrys);
¾ Convenience Stores;
¾ Pubs;
¾ Restaurants;
¾ Hotels/B&Bs;
¾ Food Retailer;
¾ Leisure; and
¾ Canteens/cafes in workplace.
Information on market distribution for the main beverage sectors was taken from
relevant DataMonitor reports.
145
The material composition of the containers sold in
each sector was then estimated.
From this data, the proportion of glass bottles, plastic bottles and cans returned to
each type of retail outlet was estimated (Table A-25). The key assumption being that
the majority of containers will be returned to the same type of retail establishment
as they were sold.
Table A-25: Total Containers Returned to Retail Outlets
Scenario Glass Bottles
Plastics
Bottles
Cans
Total
(millions)
Parallel 4,682
7,457
10,589
22,727
Complementary 5,283
8,114
11,736
25,133
Source: Canadean / Eunomia
Table A-26 shows the proportion of each retail category that is likely to pay a joining
fee and form part of the deposit scheme, and that would be able to accept the
return of all containers. It should be noted that, in this model, it is assumed that any
type of container can be taken back to any of the participating retailers. Although
this is eminently possible via RVMs or manual take back of commingled plastics and
cans, glass bottles accepted manually would need to be placed in dedicated boxes.
143
Rogers, Simon (2010) Labour’s manifesto: Where have all the pubs gone?, Accessed May 2010,
http://www.guardian.co.uk/news/datablog/2010/apr/12/general-election-labour-manifesto-pub-
closures
144
No data on the number of small retail kiosks operating in the UK was available.
145
DataMonitor provides industry profile data, www.datamonitor.com

128
In practice, it would not be recommended that all retailers store all sizes of boxes
‘just in case’ a take back is required. However, in small volumes, glass would not
restrict the retailer from accepting the container. We would expect the bottle would
probably be placed in the bag with commingled plastics and cans – this is the
current procedure in Germany and Denmark.
146
Table A-26: Percentage of each Retail Type Joining the Deposit System and
Requiring a Collection of Containers
Type of Retailer Retailers in
System
Rationale
Superstores 100%
Large sales / return volumes, so all will
join.
Medium Stores 100%
Large sales / return volumes, so all will
join.
Convenience Stores 50%
Half with small number of employees, and
lower beverage sales.
Pubs 90%
High sales volume relates to nature of
business. Most will have too many
containers to take to a supermarket etc.
Restaurants 60%
Beverage sales will be lower, enabling
smaller restaurants to opt out of the
system.
Hotels/B&Bs 70%
Split based on hotels with >10 employees.
Food Retailer 10%
Small sales volumes and small size will
mean many retailers will opt out of the
system and take stored containers to local
return points.
Leisure 50%
Less information known about the large
variation in ‘Leisure’ activities / sites. 50%
split deemed a neutral assumption.
Canteens/cafes in
workplace
10%
Most have low numbers of employees
(<10).
Kiosks 0%
All kiosks will be too small to join the
system, and therefore will take containers
to local convenience stores and
supermarkets etc.
Source: Eunomia
Furthermore, we assumed that all small kiosks would opt not to participate in the
system, and would instead take returned containers to the nearest convenience
146
Personal communication with TOMRA.

129
store, supermarket or counting depot –this is common practice in other countries,
and may be supported by a policy for granting (particularly) small businesses
exemptions from the requirement to take-back any containers other than those sold
by the particular business. As noted in the recent communication from the
Commission on deposit systems, consideration should be given to small businesses
as follows:
147
“Exemptions for small businesses - Member States may reduce some of the
operational obligations concerning deposit systems for participating small
businesses, based e.g. on de minimis considerations. To give an example:
Small kiosks may not have the storage space necessary for meeting their
take-back obligations. Therefore, it might be considered reasonable to grant
them certain exemptions. However, it is advisable to assess whether any
such exemption would not affect the overall quality and functioning of the
deposit and return system as such, or would lead to discriminatory
application of its conditions.”
The next step to consider was how the containers would be collected by retailers. In
Appendix A.3.0 it was argued that automatic take back of containers through
placing of machines in stores would be necessary to provide easily accessible take
back points for consumers in the UK.
For the purposes of this modelling, we have assumed that the automated machines
would be reverse vending machines (RVMs), though other methods of automated
collection exist, including high-speed counting machines which may be chosen by
some as a preferred collection option. Automated machines will be pragmatic for a
large number of shops across the UK, being already used in stores such as Tescos,
but will not be pragmatic for bars and restaurants. Table A-27 shows the proportions
of each retail category which we have assumed would have an RVM in their store
and the average number of RVMs per store, with the remaining proportion of each
retail category undertaking ‘manual’ container take-back. It should be noted that, for
a small proportion of those retailers classed as ‘manual’ take-backs, particularly for
bars and restaurants, the deposit may never be passed onto the consumer in the
first place as it may be relatively easy for the retailer to retain the beverage
container and serve the beverage in a glass, thereby reducing staff time required for
the manual process. However, for the purposes of ensuring that the estimation of
handling fees is not too low, we have classed all non-RVM retail outlets as requiring
the same amount of resource time for manual collection.
147
EC (2009), Communication from the Commission: Beverage Packaging, Deposit Systems and Free
Movement of Goods, May 2009

130
Table A-27: Retail Outlets Requiring RVMs and Number per Store
Type of Retailer
% of Retailers
Requiring an
RVM
No. of RVMs
per store
Superstores
100%
2
Medium Stores
70%
1
Convenience Stores
10%
1
Pubs
0%
Restaurants
0%
Hotels/B&Bs
0%
Food Retailer
5%
1
Leisure
0%
Canteens/cafes in workplace
0%
Kiosks
0%
Source: Eunomia
From this analysis the total number of retail outlets requiring an RVM in the UK is
calculated as around 36,000. The total number of RVM machines is just over
42,500. In Germany (a country with a higher population) the equilibrium number of
RVMs is circa 30,000.
148
However, Germany’s retail landscape is different. In the UK
there appear to be a larger number of stores of a size which would justify an RVM.
The total number of RVMs maybe an over estimate, but should ensure the modelling
does not under-cost the required infrastructure.
In order to check the validity of these assumptions, the average take back rate per
RVM was subsequently calculated. Assuming a 7 day opening week and two hour
peak time frame, the return rate is around five to six containers per minute. This is
eminently possible. The operating capacity of machines is around 30 to 45;
however, in practice the actual number of containers returned per minute will be
lower, relating to intensity of use and the number of users at any one time.
The number of businesses opting to join the system but not requiring an RVM is
estimated at around 150,000.
148
Personal communication with TOMRA, May 2010.

131
The combined analysis of retail outlets, market distribution, container material type
and likely take back methods, culminates in the initial flow of containers shown in
Table A-28.
Table A-28: Number of Containers Requiring Collection via RVMs of through Manual
Take Back, millions
Complementary
Parallel Product
RVMs Manual
RVMs
Manual
Glass ≤0.5 l 894 1,646
1,009
1,858
Glass >0.5 l 754 1,387
850
1,566
PET ≤0.5 l 1,599 1,974
1,740
2,148
PET >0.5 l 1,738 2,145
1,891
2,334
Cans (Fe.) 1,664 2,997
1,844
3,321
Cans (Al.) 2,116 3,812
2,346
4,225
Source: Eunomia
Note the higher quantity of aluminium cans compared to ferrous. Household
composition suggest that the weight ratio is 20:80 (Alu. to Fe.), however, the weight
of an aluminium can is around half, so the modelling suggests the figures above. No
sources of data could be found to provide further evidence as to the split of material
used for cans placed on the market. However, as we note in Section A.2.2 the
tonnage data matches up to existing sources, so the number of units should not be
significantly over or underestimated.
A.3.2.2 Reverse Vending Machine (RVM) Costs
The key cost elements associated with RVMs are a) capital costs (including
installation) and b) operating costs.
Capital Costs
In terms of capital costs, average figures of €20,000 for the machine, and €1,250
for the installation were provided by TOMRA. This equates to around £17,000 for
one RVM, and just over £1,000 for the installation.
149
The installation fee includes
fitting the machines in the store, and connecting to the back-office equipment (via
ADSL cables etc). The back-office IT equipment is then connected to the internet –
this is to link the machine to the central system.
149
Using an exchange rate of 0.849083.

132
The annual cost to the retailer for the RVM is based upon the assumption that the
retailer would purchase an RVM and repay the loan over a period of 7 years.
150
The
interest rate is assumed to be 7%.
Operating Costs
Operating and maintenance costs are assumed to be 9% of the total capital cost of
the machine.
151
Additional operating costs include the cost of paper roll for the
receipt printer (an additional 1% of total annual costs), and the cost of replacing the
compactors for compacting RVMs. This cost of replacing the compactors is €2,000.
This has to be carried out on average after every 800,000 containers have been
compacted.
Total Cost
The total annual cost to retailers for purchasing and operating RVMs is estimated to
be around £209 million under both scenarios.
A.3.2.3 Retail Space Infringement Costs
Shop space will be required for stores installing RVMs, and storage space will be
required for all retailers who take back containers. This will be a cost to the retail
industry, and as such is to be compensated for by the central system. The
methodology for calculating the financial impact on retailers for loss of floor space is
described below.
RVM Store Costs
The costs for retailers who install RVMs will be the actual cost to lease the floor
space in the sales area, the additional storage area required for the containers, and
the lost opportunity cost resulting from a reduction in floor space in the sales area.
It is estimated that an average retailer will require an area of 9 m
2
(4 m
2
sales area
+ 5 m
2
storage space). The opportunity cost of retail floor space and operator margin
(i.e. the profit the retailer would receive) are also estimated at £3,000 per m
2
per
annum and 5% respectively.
152
The rateable value of commercial and industrial properties in the UK varies from
<£25 to around £450 per m
2
.
153
The average rateable value for retail floorspace in
England was £129 in 2007.
154
Using the latest GDP deflator from HMT, the rateable
150
7 years is also expected to be the lifetime of the machine.
151
Personal communication with TOMRA, May 2010.
152
GLA (2005) Retail in London: Working Paper C Grocery Retailing, October 2005,
http://www.london.gov.uk/mayor/economic_unit/docs/retail_in_london_wpc_grocery_retailing.pdf
153
CLG (2008) Floorspace and rateable value of commercial and industrial properties 1 April 2008,
(England & Wales), Accessed 13
th
May 2010,
http://www.communities.gov.uk/publications/corporate/statistics/floorspace2008
154
Lancashire County Council (2008) Retail Floorspace 2007, Accesed 13
th
May 2010,
http://www.lancashire.gov.uk/office_of_the_chief_executive/lancashireprofile/monitors/retailfloors
pace.asp

133
value used in the modelling, in 2009 terms, is calculated as £135 per m
2
per
annum.
155
There are just over 36,000 retail outlets that are likely to install RVMs. The cost to
these retailers for loss of floor space and opportunity cost is around £65 million per
annum for both scenarios.
Manual Take Back Store Costs
The only impingement on floor space when containers are taken back manually is
the storage area. It is recognised that for some smaller businesses, this storage area
may have to be on the shop floor. The same rateable value for floor space presented
above is also used for this calculation.
If it is assumed that a containment bag (see Appendix A.3.2.5) can store, on
average, 200 beverage containers, then one retail outlet will amalgamate eight
containment bags per week. In the collection modelling, a weekly pickup rate for
each retail outlet is assumed (see Appendix A.3.2.6 below). The average collection
frequency is just under twice per week. Therefore the average retailer will have to
store 4 bags in between pickups. An area of 5 m
2
has been given to each retailer for
storing these bags.
There are just under 150,000 retail outlets who are likely to be ‘manually handling’
containers. The cost to these retailers for loss in floor space is around £101 million
per annum for both scenarios.
A.3.2.4 Labour Costs
The additional handling and collection of containers from retail outlets will demand
labour time, and therefore additional costs will be incurred by the retailer. The two
main activities requiring additional labour are:
1) Take back of containers from customers and placing in storage locations; and
2) Facilitating pickup of containers from the contracted logistics company.
The calculation of these cost elements is described below.
Labour Costs for Customer Take Back via RVMs
The outline plan for the German deposit system estimated that the time required to
process receipts from stores with RVMs was 0.3 hours per day.
156
Based on a seven
day working week and a labour cost at above the minimum wage (currently
£5.93/hr). With on-costs of 25% the hourly costs of labour used in the model is
around £8.80. The total labour cost to retailers is estimated at £30 million per
annum.
155
HM-Treasury (2010) GDP deflators at market prices, and money GDP, Last updated 31 March
2010, http://www.hm-treasury.gov.uk/data_gdp_fig.htm
156
TOMRA (2001), Zentrale Organization Einweg Pfand Deutschland: Business Model Development
Guide.

134
To add weight to the cost calculations in this section, two approaches have been
taken and an average figure used in the model. By making the following
assumptions, it is possible to derive a different cost of labour as follows:
¾ Each customer returns an average of 15 containers in one go;
¾ It takes 10 seconds for the retailer to process the receipt and reimburse the
customer with the monetary value of the accumulated deposits;
¾ Each ‘average sized’ RVM has a storage capacity of 300 containers;
¾ The time taken to empty the RVM when it is full and store the containers at
the back of the store is 5 minutes; and
¾ Staff are unskilled and paid the minimum wage.
This secondary approach values the time taken for the shop assistant to both
process receipts and empty machines. The total cost estimated using this approach
is around £39 million per annum.
An average of the two approaches is around £34 million for both scenarios. This is
the figure used in the modelling.
Labour Costs for Manual Customer Take Back
For retail stores, the labour costs for manual take back will be associated with
additional time to collect the containers from the customer, pay the deposit, and
place the containers in the designated storage area. Operational experience from
existing systems shows that most retailers will have an intermediate storage bag
close to the cashier. When it is full, the bag will be sealed and taken to the storage
area.
The time taken for the cashier/ waiter to accept an average of 15 containers and
store them is estimated at 45 seconds.
With the labour costs valued at above the basic wage, the total cost to retailers who
implement a manual take back policy is estimated at £113 million and £102
million for the complementary and parallel systems respectively.
Labour Costs for Customer Take Back from Retailers Outside of Deposit System
Some of the smaller retailers, such as corner shops, kiosks, and cafes, will not
receive a high enough volume of containers to warrant paying the joining fee. This is,
in one way, a valued side effect, enabling the efficiency of the overall collection
logistics to be greatly improved by concentrating the volume of containers in a
smaller number of locations. However, on the negative side, an additional cost will
be incurred by these retailers in having to store a small number of containers and
subsequently deposit the containers at local take-back points to redeem the
deposits. Rather than being included in the running costs of the deposit system, this
cost should be included in the overall cost benefit analysis. It is discussed in this
section of the report only because the methodology is closely linked to that used in
the calculation of the labour costs presented above.
In this calculation it is assumed that the small retailer will be able to store
containers for around 14 days. This could be much less for some retailers,
particularly if they were to take containers back to, for example, a cash and carry

135
whilst purchasing new goods for sale. However, in order to take a conservative
approach, we have assumed a storage period of 14 days for all small retailers.
Furthermore, it will take half an hour of labour time to visit a local take back point
and redeem the deposits. Again the cost of labour is valued as above.
Assuming that 70% of the total number of retail outlets categorised at the start of
this section stock beverages (even though some leisure outlets and canteens will
just serve food), the total cost to these businesses will be around £19 million.
Labour Costs for Container Collection
In implementing a deposit refund system, there would potentially need to be three
main avenues of collection services for the retailer: one for refuse, one for beverage
containers, and one for other recyclable materials. Although it is assumed that the
volume and hence frequency of refuse and dry recycling collections would be
reduced alongside the deposit system, the overall labour cost is assumed to be
higher, given that staff would have to set out waste for collection on three separate
occasions. Hence, an additional labour cost of 5 minutes per container pickup has
been included in the calculations. Estimates for the number of pickups required per
week for each of the main retail categories was also made (see Table A-29). Labour
is valued at higher than an unskilled rate, as more senior staff may need to facilitate
this process. A rate of £9 per hour has been used (plus 25% on-costs).
Table A-29: Retailers Requiring Collection and Pickups per Week
Type of Retailer
Number of Retailers
Requiring a Collection
Pickups per
Week
Superstores
0
7
Medium Stores
11,550
4
Convenience Stores
12,125
3
Pubs
23,400
2
Restaurants
13,500
2
Hotels/B&Bs
30,240
2
Food Retailer
2,610
1
Leisure
8,550
0.5
Canteens/cafes in workplace
8,455
2
Kiosks
0
0
Source: Eunomia

136
The total cost of labour time to retailers for facilitating the collection of containers is
estimated at £13 million per annum.
A.3.2.5 Logistics Container Costs
Many permutations of setup for the transportation of containers are possible. The
nature of the system is dependent upon whether or not the containers have been
cleared.
If the containers have already been cleared through the RVM/ automated machine
in-store, the shape of the containers does not need to be preserved for downstream
recognition. Consequently, the items can be compacted and an applicable
containment device used. Experience from other countries suggests that collapsible
plastic bins are a useful mechanism for transportation of compacted containers
received through RVMs (see Figure A-7-5). When backhauling, these bins could be
stored folded up in the vehicle and given to the retailer to replace the full bin.
Alternatively, logistics companies could use existing delivery devices. Common
practice is to use wheeled storage cages. However, placing the compacted
containers in the cages may be time consuming. Furthermore, additional
containment would be required to manage the loose items. Taking a conservative
approach, it has been assumed that new collapsible bins would be required by all
retailers or logistics companies. The following assumptions have been made in the
calculation of the resultant containment costs:
¾ An average capacity figure, for all container types, of 1,400 per bin;
¾ Each bin will be in use or storage for a period of 14 days before being refilled;
¾ The cost for one bin is £125;
157
¾ A nominal charge or £5 per bin for cleaning has been included;
¾ The lifetime of the bin is three years; and
¾ The value of the bins has been annualised over a period of three years at an
interest rate of 7%.
Subsequent calculation of an average of five bins per store was considered a
reasonable number in providing a sense-check for this section of the modelling.
157
Personal communication with TOMRA, May 2010

137
Figure A-7-5: Collapsible Bins for Transporting Compacted Containers
For containers which have not been cleared, the transport mechanism has to be
able to maintain the fidelity of the attributes used by the automated counting
centres, for example, the barcode, shape and weight of the container. Therefore the
transport process must retain these key attributes for each container. Plastics
bottles and cans will sufficiently maintain their shape for recognition, as long as no
direct pressure is exerted. Again, common experience from other countries,
including Norway, Sweden and Germany, suggests that plastic bags are sufficient for
containment of plastic bottles and cans. This is similar to many kerbside collections
of plastic bottles already in place in the UK.
158
Bags are stored either at the front of
a shop, or in the backroom storage area in supporting frames. When full, they are
sealed and tagged ready for collection (see Figure A-7-6).
Figure A-7-6: Plastic Bags with Empty Beverage Containers for Transportation
158
WRAP (2007), Annual Local Authorities Plastics Collection Survey 2007, June 2007, available at
http://www.wrap.org.uk/downloads/Wrap_ReportDisclaimerSmaller.513fb4e1.3869.pdf

138
The number of bags required per year is estimated from the total number of
containers requiring collection and the number of containers that can be transported
in each bag. Each bag is designed to take approximately 150 PET bottles or 250
cans.
159
The cost of a bag and a tag is modelled at 67p. In reality, this cost could go
down if bags are reused, or the purchasing power of the central system comes into
play, and all 52 million bags are ordered in bulk and distributed to retailers
accordingly.
For glass containers there is a much higher propensity for breakages due to the
nature of the material. Therefore plastic crates are required to transport the
containers to counting centres (see Figure A-7-7). The total number of crates
required and the total cost was calculated using the following assumptions:
¾ Each crate can hold around 40 glass bottles. Crates will therefore need to be
stackable in order to ensure that there is sufficient storage room in busy
periods, particularly from retailers such as pubs;
¾ Each crate will be in use or storage for a period of 3 days before being
refilled;
¾ The cost for one crate is £10;
160,161
¾ A nominal charge or £1 per crate has been included for cleaning;
¾ The lifetime of the crate is 3 years; and
¾ The value of the bins has been annualised over a period of 3 years at an
interest rate of 7%.
Figure A-7-7: Plastic Crate for Transporting Glass Bottles
159
TOMRA (2001), Zentrale Organization Einweg Pfand Deutschland: Business Model Development
Guide
160
Solent Plastics (2010) Recycle Bins / Recycling Storage / Segregated Bins / Waste / Rubbish
Bins, Accessed 20
th
May 2010, http://www.solentplastics.co.uk/recycling-rubbish-waste-bins/
161
PHS, Teacrate (2010) Retail and Logistics, Accessed 20
th
May 2010,
http://www.teacrate.com/retail-and-logistics.aspx

139
Based on the assumptions outlined above, the total cost of containment devices is
estimated at £54 million and £49 million for the complementary and parallel
systems respectively.
A.3.2.6 Transport Costs
The transport costs have been modelled with the UK situation in mind, not simply
copied from existing systems in other countries – although these were used to
understand some general principles. The main principles were:
¾ Backhauling using existing logistics networks is common practice for larger
retailers (e.g. supermarkets);
¾ Containers from smaller outlets are collected by logistics contractors using
curtain-side, or back lift, lorries, in the range 7.5 to 18 tonnes;
¾ Containers are transported directly to recyclers, or to counting centres for
clearing.
The area which will provide the greatest potential for financial savings is
backhauling. This is where delivery vehicles that distribute products to shops, bars
etc, will fill the empty space with returned deposit containers, rather than the
current practice which is to return to the depot empty. Therefore, we have modelled
the collection logistics using both backhauling and collection rounds direct to the
retail outlet. The system is summarised in Figure A-7-8 and described under each of
the subsequent headings.
Backhauling
Where possible, it is recommended to backhaul containers using existing logistics
infrastructure. This would be a simpler task where a large retailer is in control of its
own logistics, or a large distribution company delivers the majority of the products to
a store.
For smaller shops, which are supplied by a larger number of independent traders,
backhauling would be less beneficial for the supplier, as transporting the smaller
volume of containers to a recycler or counting centre would be less efficient. What
the fulcrum of cost to benefit would be is unclear from this high level analysis.
However, what can be assumed is that retailers and suppliers will seek to optimise
their arrangements in the most appropriate manner and that back-hauling where
possible will reduce the overall logistical costs of collecting and hauling material,
Estimates regarding the proportion of each retail category able to backhaul are
shown in Table A-30. The key assumptions in the setting of these conditions were:
¾ All supermarkets are of a large enough size to warrant backhauling;
¾ Far fewer medium sized stores would be large enough to warrant
backhauling;
¾ 20% of convenience stores will be serviced by large-scale distribution
companies which will backhaul;
¾ Half of pubs (whose main trade is beverages) will be supplied by a
distribution company large enough to backhaul. In practice many pubs are
supplied by a small number of large suppliers or breweries, so in reality the

140
potential for backhauling using existing collection logistics could be more
substantial than estimated; and
¾ The potential for backhauling is diminished when considering other catering
sectors due to the lower volumes of containers per outlet.
The marginal cost to the distribution company for backhauling to their centralised
depot would be a minor increase in fuel usage, due to the increased weight of the
returning vehicles. Labour time is assumed to remain constant as vehicles need
loading with returned logistics cages regardless. In fact some of the capacity in the
cages will already being used to backhaul card and plastic packaging to central
depots for recycling. Change in fuel costs are not easy to estimate at the macro
level, hence this has been excluded from the analysis. We recognise this limitation
in the modelling, but would suggest that the total impact would be low when
compared to the overall costs of the system.
As can be seen from Figure A-7-8 the backhauled containers from the retail outlets
are transported back to a central collection depot.
162
The types of retail outlets for
which backhauling will be more likely are closely aligned to those which will be
installing an automated take-back system, such as an RVM or counting centre. This
means that nearly 80% of the backhauled containers will already be ‘cleared’ in the
central system and compacted ready for transport.
163
Consequently, loading and
unloading of the collection vehicles will be more efficient. Nonetheless, some
clearing and compacting of containers will still be required. This will either take
place at the centralised depots, using automated high-speed counting devices (the
costs of which are discussed in Appendix A.3.2.7), or via transportation to one of the
many centrally operated counting centres (again, discussed in Appendix A.3.2.7); the
additional transportation is assumed not to be significant in this case (because they
would have to return to depots anyway which could be just as far in reality).
Plastic bottles and cans will be baled ready for transportation to reprocessing
centres in the UK, or to nearby docks for export abroad. This will happen using the
retailers existing fleet of large scale transporters (articulated lorries etc). Bales will
simply be fork-lifted on and off the vehicle. Under this approach the potential for
backhauling is also high. However, we have included this as a real cost to either the
retailer or distributor.
Glass, however, must be treated differently. When compacted, the density and
nature of the material means that a containment device is required for
transportation. Existing systems use skips (which could be of any size) to store the
cullet, either colour segregated or mixed. It is not thought that there would be much
appetite for the retailers to expand their vehicle fleet to facilitate the transportation
of skips. Therefore, we have modelled the collection of colour separated glass being
contracted to local waste management companies. These companies may then
transport the material to the North East for re-melting, local docks for export, or to
other reprocessing activities.
162
It is recognised that some optimisation, or expansion, of depots may be required.
163
‘Cleared’ means that the container has been processed and recorded as returned in the central
system, and the subsequent handling fee and deposit can be paid out to the retailer.

141
Figure A-7-8: Transport Requirements for Container Collection
Backhauling of Containers
Dedicated Collection Rounds
Return Locations / Point of Collection:
M anual / Automat ed Takeback
Pubs
Convenience
St o r e s
Caf e s e t c
Medium Stores
Supermarkets
Fast Foo d
B& Bs / Hot el s
Re s t a u r a n t s
Lei sur e
Ret ai l er s Logi st i cs Depot :
Uncleared Containers
(non-RVM)
Count ing Machines
(linked to clearing
house) + Compactor
Bal er f or
Pl ast i cs +
Ca n s
Cleared and compacted
containers from RVMs
Sk i p s f o r
Gl a ss
Local
cont r act ors
collect glass
Retailer transport s t o
centralised reprocessors
via large articulat ed
vehicles (potential for
backhauling)
Counting Centres: Localised and/ or Cent ralised
Uncleared Containers
(non-RVM)
Count ing Machines
(linked to clearing
house) + Compact or
Bal er f or
Pl a st i cs +
Cans
Cleared and compacted
containers from RVMs
Sk i p s f o r
Gl a ss
Local
cont r act ors
collect glass
Transport t o centralised
reprocessors via large
art iculat ed vehicles

142
Table A-30: Backhauling from Retailers
Type of Retailer % of Retailers
able to Backhaul
Superstores 100%
Medium Stores 70%
Convenience Stores 20%
Pubs 50%
Restaurants 10%
Hotels/B&Bs 10%
Food Retailer 10%
Leisure 10%
Canteens/cafes in workplace 5%
Kiosks 0%
Source: Eunomia
The transportation costs for enterprises backhauling containers from retail outlets is
therefore calculated as the combination of the cost to transport baled plastic and
cans to a central reprocessor or exporter, and the cost of contracting out the
collection of glass stored in skips. These calculations follow.
For the transport of baled plastics and cans from central depots to a reprocessor,
the following assumptions were made:
¾ The average load capacity of the transporting vehicle is 22 tonnes;
¾ The average distance from depot to reprocessor is 300 km; and
¾ The average haulage cost, per km, is 84p.
164
The total cost of backhauling plastics and cans is estimated at £3.3 million and £3.0
million for the complementary and parallel systems respectively.
For the transport of glass via local collection contractors, the following assumptions
were made:
¾ The average skip capacity is 10 tonnes;
¾ The average distance from depot to local reprocessor is 70 km; and
164
Calculation based upon a haulage cost of £1 per mile (average current prices) and 20% of return
journeys not enabling backhauling i.e. a real cost.

143
¾ The average haulage cost, per km, is £1.40.
165
The total cost of collecting backhauled glass is estimated at £9.9 million and £8.8
million for the complementary and parallel systems respectively.
Dedicated Collection Rounds
For many smaller businesses the possibility of backhauling will be limited due to the
multiple suppliers servicing the outlet. Organising the loads of vehicles delivering
mixed products (including non-beverages) to a large number of different locations
would be challenging. Without further dedicated research into supply logistics, it is
difficult to ascertain whether any additional backhauling might be possible via some
of the suppliers. As the scope of this study does not cover such research, we have
assumed that less rather than more backhauling will occur.
Table A-31 shows the proportion of each retail category which would require a
dedicated collection of containers.
Table A-31: Dedicated Collection from Retailers
Type of Retailer % of Retailers
Requiring a
Dedicated
Collection
Superstores 0%
Medium Stores 30%
Convenience Stores 80%
Pubs 50%
Restaurants 90%
Hotels/B&Bs 90%
Food Retailer 90%
Leisure 90%
Canteens/cafes in workplace 95%
Kiosks 0%
Source: Eunomia
Under these assumptions, just over 15 billion containers would require collecting
from around 150,000 locations throughout the UK every year. Figure A-7-8 shows
165
Calculation based upon a haulage cost of £1 per mile (average current prices), for both legs of the
journey.

144
that the collected containers would be transported to dedicated counting and
processing centres (see Appendix A.3.2.7). The setup would be similar to that
described above at the centralised collection depots of retailers – requiring counting
of un-cleared containers, baling of plastics and cans, and storage of glass cullet in
skips. The down-stream transport arrangements will also be the same – baled
plastic and cans taken to a central reprocessor and glass collected by local
contractors. The main elements in the cost calculations, therefore, are a) transport
to counting centres and b) subsequent transport to reprocessing.
As described above, the types of stores installing RVMs are assumed to be similar to
those which could effectively utilise backhauling. Therefore, the majority of
containers collected on dedicated collection rounds will be uncleared and
uncompacted. Plastic bottles and cans will be comingled in heavy-duty bags,
potentially including glass where the quantities are small. Where volumes of glass
are significant, reusable plastics crates will be employed (see Appendix A.3.2.5). In
Germany, for example, containers collected on dedicated rounds are transported in
plastics boxes of Europallet size, and on vehicles with tail-lift, or the like.
166
However,
the nature of the collections will be different in a UK system.
Taking the existing type of waste collection vehicles in the UK into consideration and
the requirement to collect mostly bagged low density containers, the following
vehicle setup has been assumed for this study:
¾ Vehicles will be 12 to 18 tonne curtain-siders, or back lifts;
¾ Sealed boxes for glass will be stacked on the floor of the vehicle; and
¾ Cages will be used to store bags of comingled plastic bottles and cans above
the glass.
In reality, the design of the collection vehicles will vary according to service provider
and will depend on the detailed logistics that are required for the collection systems
in different areas. Nonetheless, the basic vehicle set-up described above should
provide a logical starting point on which to model the required collection logistics at
a UK-wide level.
A simple collection model was developed to estimate the number of vehicle days
required per annum to collect the containers, and the cost of operation per vehicle.
The key assumptions are listed below:
¾ Number of pickups per week (see
Table A-29);
¾ Bulk densities of the containers, estimated based upon likely number per
Europallet, and knowledge of wastes collected in the UK for recycling:
167
• Glass bottles – 93 kgs/m
3
compacted and 111 kgs/m
3
un-
compacted;
166
TOMRA (2001), Zentrale Organization Einweg Pfand Deutschland: Business Model Development
Guide.
167
Personal communications with TOMRA and Andy Grant, Eunomia

145
• Plastic bottles – 27 kgs/m
3
compacted and 17 kgs/m
3
un-
compacted;
• Cans – 455 kgs/m
3
compacted and 83 kgs/m
3
un-compacted;
¾ 70% of retail outlets requiring a collection will be urban, 30% will be rural;
168
¾ There are 18 cages (2 m
3
each) on a larger urban vehicle, and 9 on a smaller
rural vehicle;
¾ Drivers work a 9.5 hour day;
¾ Time is required to drive to and from the round and tip when the vehicle is
full;
¾ It takes an average of five minutes to pickup containers from each store;
¾ It takes eight minutes to travel between stores in urban areas and 15
minutes in rural areas;
¾ The cost to operate a vehicle per day (including capital costs, driver wage,
fuel cost, maintenance etc, and a large overhead) is estimated at around
£310.
The following ‘sense-checks’ were made to make sure the model was not generating
spurious results:
¾ The average volume of containers picked up per store is 2 m
3
. This seems
reasonable, being at around 2/3 of a large bag load;
¾ Individual vehicles collect between 2 and 4 tonnes when full, depending on
size. Again, this low weight is reasonable considering the low bulk density of
un-compacted plastics and cans;
¾ The cost of collecting the containers is around £127 per tonne. This is not
inconsiderable, but the nature of the collections– small quantities, from a
large number of locations, and requiring frequent collections – suggests that
this would not be unexpected.
The total cost of collecting containers through dedicated collection rounds is
estimated at £152 million for both the complementary and parallel systems.
Finally, and following the same assumptions as described previously, the total cost
of transporting the cleared and compacted containers to reprocessors was
calculated as £16 million and £14 million for the complementary and parallel
systems respectively. This equates to around £13 per tonne of waste collected.
A.3.2.7 Counting Centre Costs
A counting machine is an automated machine which, simply put, counts and
registers used beverage containers that have been collected manually by an
individual retailer. They are high-speed devices which accept a commingled stream
168
Note this may not represent the split of all stores in urban / rural areas. It is likely that very rural
stores will opt out of the system so the consumer has to return containers to large centralised
supermarkets in more urban areas.

146
of beverage containers as their input. Any container included in the system, be it
plastic, glass or metal can be recognised by the machines. The bar code on each
container is scanned, and the information is uploaded onto a database in order for
the central system to determine what deposits and handling fees need to be paid to
which retailers.
A small number of counting machines will probably be required at some retailer and
supplier logistics depots, in order to clear any containers not received via RVMs or
other automated systems. However, the majority of counting machines required
would be those used by the central system. It is not within the scope of the study to
consider spatial distribution of counting centres. However, it could perhaps be
assumed that counting centres would follow the distribution of population across the
UK.
The system design and costs have been constructed by Anker-Andersen – a supplier
of high-speed counting machines (HLZ) - which is based in Denmark.
169
The
specification of the system was simply to be able to process the 15 billion
containers returned manually to stores around the UK. The collection and
transportation costs from the retailer to the counting centres are calculated in
Appendix A.3.2.6. The key assumptions involved in the setup of the counting centres
system are described as follows:
¾ There will be around 95 centralised counting centres each with two high-
speed machines located around the UK. These will most likely service areas
of higher population, around cities and large towns;
¾ There will also be around 328 smaller scale local counting centres distributed
around areas of lower population density, such as towns;
¾ This setup will ensure collection vehicles do not have to travel a significant
distance from the end of a round to a counting centre;
¾ Labour costs for operating the centres are equivalent to the UK minimum
wage (£5.93 in 2010, plus 25% on-costs);
¾ Centralised counting centres are operated on a two shift basis, and regional
centres on a one shift basis;
170
¾ Industrial floorspace costs have been estimated at £80 per m
2
per annum;
171
¾ Installation and service costs are included in the calculations;
¾ Each counting centre includes a separate compactor and baler for clear PET,
coloured PET, ferrous cans and aluminium cans; and
169
http://www.anker-andersen.com/
170
This allows a greater capacity at the introduction of the system, as centres will be able to operate
on a higher shift pattern. The experience from Germany was that many stores initially operated
manual take back whilst RVMs were being installed.
171
King Sturge (2010) Industrial / Distribution Floorspace Today, March 2010, Accessed 18
th
May
2010, http://www.kingsturge.co.uk/research/industrial-distribution-floorspace-today-IDFT-march-
2010.aspx

147
¾ An additional factor to account for the counting centres required to process
un-cleared containers collected via backhauling is also included. An
additional 20% increase in the number of machines is required to manage
these containers.
Consequently, the total cost of clearing and processing containers returned
manually is estimated as £74 million and £67 million for the complementary and
parallel systems respectively.
A.3.2.8 Calculated Handling Fees
Given the detail provided above regarding the differences between the automated
and manual takeback systems, the total handling fee payable to the retailers was
calculated separately for those retailers that will be likely to use an automated
machine compared to those undertaking manual takeback. For the former, the total
handling fee is calculated at £362 million and £359 million per annum for the
complementary and parallel systems respectively. This equates to around 4p per
container handled via an automatic machine. For the latter manual takeback
system, the handling fee is calculated at £214 million and £203 million per annum
for the complementary and parallel systems respectively, equating to around 1p per
container handled.
A.3.3 On-Going Costs for Central System
It has proved somewhat difficult to find much detailed information in relation to the
breakdown of actual on-going costs associated with administration of the central
system in those countries that currently operate a deposit refund system. Even
where we have been able find an overall central system cost, little breakdown is
provided as to how this has been calculated in order to try and apply equivalent
costs to the UK situation in our modelling. We have, however, been able to establish
the numbers of staff involved in administration in the Palpa system in Finland (12
staff), a system which is similar to that which we have modelled for the UK, with the
majority of functions outsourced (including collections, haulage, counting centres
and bulking), and the admin system focusing on overseeing the whole process,
database upkeep, accounting processes, marketing of materials and
communications around promoting the deposit refund system to the public.
172
Although customer services is outsourced in the Palpa system, we were also able to
establish that 2 to 3 staff are involved in the outsourced provision of customer
services. We have thus been able to scale the staff numbers up to the UK situation
based on population, with a small amount of economies of scale factored in (though
even without such consideration, the overall admin cost for the system would only
be £1.8 million higher than modelled here). The overall on-going costs for the central
system are presented in
Table A-32.
Given the importance of a fully integrated product database and financial
accounting system in the smooth running of the central system administration
function, we have tried to be conservative in terms of the on-going IT costs that the
172
Personal communication with Pasi Nurminen from Palpa, Finland, August 2010.

148
system might face, and have thus factored in a total of £4.1 million IT costs per
annum, to cover both the database and accounting system, and any additional
system requirements for customer services.
Table A-32: Costs for Administering the Central System
Item
Assumption Total Cost
(£m)
IT costs Maintenance
£0.25m
On-going hardware and software costs
£0.25m
Licences
£30k per licence £3.6m
Total IT costs
£4.1m
Staff costs Number of database/accounting staff
100
Average salary + on-costs (@25 %)
£37.5k
Number of customer services advisors
20
Average salary + on-costs (@25 %)
£25k
Total staff costs
£4.25m
Office space
costs
Average leasing cost for fully
equipped/furnished office
£500 per person
per month
£0.24m
Total office space costs
£0.72m
Total support services costs (e.g. Legal, HR)
£0.6m
Total communications/marketing
£5m
TOTAL £m PER ANNUM £14.7m
For staffing costs, we have based the potential number of staff on discussions with
Palpa (Finland), and we have assumed a total headcount of 120 people, with higher
average salaries for the more technical staff than for the customer services
advisors.
173
For office space, we have also taken a conservative approach and have used the top-
end cost of leasing a fully-equipped and furnished office in a city centre such as
Bristol which would accommodate 120 members of staff.
174
We have also included
an additional £600k of support service costs to cover any legal or HR costs that
might be incurred by the central system.
Finally, we have added in £5 million per annum of communications/ marketing
costs, to ensure that the system continues to be well publicised. The overall cost of
173
Personal communication with Pasi Nurminen from Palpa, Finland, August 2010.
174
Personal communication with Regus Office Solutions, 4
th
June 2010, http://www.regus.co.uk/

149
administering the system is thus calculated at £14.7 million per annum for both the
complementary and parallel deposit systems.
A.3.4 Material Revenues
The material revenues that have been allocated to the material that is collected
through the kerbside collection system and deposit refund system are based on a
combination of information from LetsRecycle, and from our own knowledge of
materials markets in the UK.
175
For the commingled kerbside recycling system, it is
assumed that, rather than receiving material revenues for this material, a gate fee
of £38 per tonne would be payable in order to sort the material before it can be sent
on to reprocessors. For the two-stream kerbside recycling system, it is assumed that
material revenues would be obtainable from the collection of paper and card as a
single stream, but that a materials recovery facility (MRF) gate fee would be payable
in order to sort the containers which would offset the benefits derived from the
fibres, leading to an overall zero net benefit from the sale of material in this system.
Hence the only two systems modelled as generating an overall income from the sale
of materials are the kerbside sort system and the deposit refund system. The
material revenues used for these two systems are given as follows:
¾ PET bottles - £220 per tonne for material collected through the deposit
refund system, compared to £150 per tonne for kerbside-sort collected
material;
¾ Glass bottles - £12 per tonne through the deposit refund system. The
potential income from glass bottles is assumed to be lower than that which
can be achieved from collection at the kerbside (£22 per tonne), as we have
assumed that the material will require collection by local contractors who
then transport to Yorkshire for remelting or to dockyards for shipment
abroad, hence reducing the overall revenue that can be obtained;
¾ Steel cans - £66 per tonne for material collected through the deposit refund
system, compared to £60 per tonne for kerbside-sort collected material;
¾ Aluminium cans - £900 per tonne. This is higher than the income that we
would expect to be obtained at the kerbside (£600 per tonne), as we have
assumed that the high quality compacted and baled used beverage
containers will be delivered direct to outlets such as Novelis, Warrington (an
aluminium roller and can recycler plant).
A.3.5 Administration Fee
The administration fee payable by the producer/importer to the central system
alongside the deposit has been calculated as follows:
175
http://www.letsrecycle.com/materials/

150
Calculating the administration fee in this way ensures that the balance of costs and
benefits for the retailer and the central system is zero. The overall administration fee
is subsequently divided by the number of containers that are placed on the market
in order to obtain a unit cost to the producer/importer for each container that might
potentially end up being returned and subsequently recycled as part of the deposit
refund system.
The administration fee payable by the producers for every unit placed on the market
has been calculated at 0.7p for the complementary deposit system. This falls close
to the range of administration fees set by a number of existing deposit refund
systems e.g. 1 to 4p per unit in Finland (dependent on material), just over 2p per
unit in Estonia, 1.6p per unit in Maine, USA.
176,177,178
For the parallel system, the
administration fee has been set at zero; in this case, based on our assumption that
the return rate would be lower in the parallel system and that the deposit would be
15p/30p for smaller/larger containers in both systems, the unclaimed deposit more
than offsets the costs of administration that the producer would otherwise be
expected to cover. It is important to note that the administration fee will be sensitive
to both the return rate and the deposit, a fact which is explored in more depth in the
sensitivity analyses undertaken in the main report. The setting of the administration
fee will thus need to be re-visited over time following introduction of a deposit
scheme to ensure that the fee continues to cover the cost of the system.
A.3.6 Set-Up Costs
As with the on-going administration costs of the central system, there is little
detailed information publicly available on the initial set up costs that would be
required for the deposit refund system. We have therefore constructed the costs that
we believe would be associated with setting up this type of system, based primarily
on what tasks would be required and when (provided by TOMRA), and the associated
number of days that would be required for each task.
179
A breakdown of the key
tasks involved and the resource and capital costs that we suggest would be involved
in developing and implementing the system are given in Table A-27. Based on the
modelling, a total cost of £32 million would be required to set up the central deposit
refund system, plus an additional £1.25 million for the producers to change their
labelling, and an additional £51 million for the retailers to adapt their store areas to
accommodate the new system requirements.
It is worth noting that although some producers may need to change their printing
procedures in order to ensure that the correct barcode is applied to containers
destined for the UK market, the actual changing over of labels will more than likely
coincide with the periodical changes that the producers already have to make in
176
http://www.palpa.fi/english,exchange rate at 0.8813
177
http://www.eestipandipakend.ee/eng/epp, exchange rate at 0.0553
178
http://yosemite.epa.gov/ee/epa/eerm.nsf/vwAN/EE-0216B-06.pdf/$file/EE-0216B-06.pdf,
exchange rate
at 0.6909
179
TOMRA (2001), Zentrale Organization Einweg Pfand Deutschland: Business Model Development
Guide.

151
their printing process; hence, as long as sufficient lead-in time is given to producers,
then the cost of changes to labelling should be able to be kept to a minimum.
179
As stated previously, no literature has been unearthed which provides a detailed
calculation of joining fees for either producers or retailers associated with these one-
off costs. Joining fees vary across existing deposit schemes; for example, in Finland,
the producer can opt to pay either a one-off lifetime joining fee of £6,698, or an
annual joining fee of £1,498 over a 5 year period, and must also pay a per product
additional fee of around £300 in both circumstances.
180
In Denmark, the joining fee
for producers is £238 per annum, and retailers also pay an annual fee of £59 to
make them eligible to receive handling fee payments.
181
In Norway, a one-off joining
fee of £3,307 is charged for each producer, plus an additional £551 per product.
182
For the purposes of this high level modelling, we have not attempted to split the one-
off costs into joining fees per producer or per retailer. A number of key decisions
would require further consideration beyond this study in order to determine how the
one-off costs of the system would be covered, including the following:
¾ Should both the producer and the retailer be charged a joining fee?
¾ If so, how should the one-off costs of the central system be split between the
producer and the retailer?
¾ Should the fee be a one-off membership, or an ongoing annual fee?
¾ Should a per product fee be charged on top of a more general fee in order to
reflect the size of producer/ retail outlet?
180
http://www.palpa.fi/english,exchange rate at 0.8813
181
http://www.dansk-retursystem.dk/content/, exchange rate at 0.1189
182
http://www.resirk.no/Calculator-83.aspx, exchange rate at 0.1102

152
Table A-27: Key Tasks and Resources involved in Implementing a Deposit Refund System
Total Resources (Days) Required per Month to Deliver Task
Task 1
2
3
4
5
6
7
8 9 10
11
12
Total Days
Resource
Cost*
Capital
Cost
Total Cost
Central System Costs
Model Decisions
Create reference groups
15
15
30
£
45k
Fee structures
10
10
20
£
30k
Decide on new central organisation
10
5
15
£
22.5k
Finalise stakeholder requirements
10
5
15
£
22.5k
Work out the clearing house model
20
20
40
£
60k
System security policy
5 5
10
£
15k
Logistics approach
5 5
10
£
15k
Nominate supervisory board
5
5
£
7.5k
Review and approve model
10
10
£
15k
Build Interim Organisation
Appoint executive team
25
25
£
37k
Create legal entity
30
30
£
45k
Complete start-up budget
30
30
£
45k
Procure and secure financing
25
25
£
37.5k
System Construction
Procure logistics transport pool and
associated IT solutions (in-cab, hand-
held etc)
50
50 £75k £5,750k
Find office for clearinghouse
10
10
10
30
£
45k
Stakeholder communications
5 5 5 5 5 5 5 5 5
45
£
67.5k
Wider public advertising
20
20
20
20
20 20 20
30
30
200
£
300k
£15,000k

153
Total Resources (Days) Required per Month to Deliver Task
Build container database
3 3 3 3 3
15
£
22.5k
£3,450k
Stakeholder enrollment
5 5 5 5
20
£
30k
Clearinghouse solution
5 5 5 5 5
25
£
37.5k
Acquire or build processing centres
5 5 5 5 5 5 10
10
50
£
75k
Recruit staff
10
10
10
10
10 10 10
10
10
90
£
135k
Populate database
5 5 5
15
£
22.5k
Set up call centre
5 5 5 5 5 5 5 5 5
45
£
67.5k
£2,000k
Legal and consultancy fees
(management of)
2 2 2 2 2 2 2 2 2 2 2 2 24 £36k £4,000k £31,510k
Producer Impacts
Change labeling to meet requirements
(based on additional 5 day resource to
change label printing per producer, total
1,000 producers/ importers
183
)**
5000 5000 £750k £500k £1,250k
Retailer Impacts
Optimising outlet floor space to
accommodate takeback of containers
(manual only)***
1 1 1 472,890 £35,466k
£15,800k
£51,266k
*Day rates are set at £1,500 for all tasks except the producer and retailer impacts. A day rate of £75 has been used for the retailer impacts, based on
staff in each outlet undertaking the store adjustments. A slightly higher day rate of £150 has been used for the producer impacts, for staff that work in
printing the labels.
*This is likely to be an over-estimate as in reality producers will already change labelling approx. every 6 months anyway so the new labelling requirements
should simply form part of this usual cycle of adjustments.
***Note the number of days is per retailer i.e. three days per retailer that would need to make these adjustments.
183
Wetherill, Paul (2009) UK Business: Activity, Size and Location – 2009, An Office for National Statistics Publication, September 2009,
http://www.statistics.gov.uk/downloads/theme_commerce/PA1003_2009/UK_Business_2009.pdf

154
A.4.0 Additional Cost Modelling
Appendix A.4.0 describes the methodology for calculating the change in collection
tonnages and hence the associated costs from a reduction in household kerbside
arisings. Appendix A.3.0 explains the determination of the costs of operating the
deposit system under both scenarios.
In examining the complete waste management system for dealing with beverage
container waste, additional cost assumptions are also required in order to model the
potential effects of introducing a deposit refund system on the following waste
management routes:
¾ Collection of containers through bring sites;
¾ Collection of containers through Household Waste Recycling Centres
(HWRCs) – both recycling and disposal;
¾ Commercial waste recycling / refuse collection; and
¾ Collection of containers from on-street litter bins and through street
sweeping.
Determination of the change in costs for each of these collection routes associated
with the introduction of a deposit scheme is thus described in the Sections below.
These figures will undoubtedly vary across the regions and sub-regions of the UK.
However, for the purposes of the modelling presented here, we have mainly drawn
from existing Eunomia studies completed in the first few months of 2010 in order to
obtain average costs for each collection route.
184,185
Again, the level of detail was
limited in these macro level studies. However, the figures used are considered to be
good estimates for realistic potential savings associated with a reduction in the
need to collect beverage containers through each method. Furthermore, given the
uncertainties, we have chosen conservative figures in all cases throughout this
study, especially when estimating cost savings.
A.4.1.1 Bring Sites
An average figure for the incremental cost of collecting materials through bring sites
(those that collect cans and bottles) was estimated to be £15 per tonne of waste
collected. Whether this cost would indeed be the saving achieved from the
incremental reduction in waste collected is unknown. In principle, the most likely
financial saving associated with a reduction in beverage containers at bring sites
would be from the reduced frequency of collections required, rather than from a
reduction in the number of bring sites.
Given that a high proportion of the small quantities of waste that are deposited at
bring sites are typically beverage containers, the introduction of a deposit refund
system could lead to a noticeable fall in the frequency of collections required at
184
Eunomia (2010) Landfill Bans Feasibility Research, Final Report for WRAP, March 2010,
http://www.wrap.org.uk/downloads/FINAL_Landfill_Bans_Feasibility_Research.f5cf24f9.8796.pdf
185
Eunomia (2010) Economics of Waste Management in London, Report produced for the GLA

155
bring sites. This could significantly reduce the number of collection vehicles required
by an authority, further increasing the ‘per tonne’ saving. Given our wish not to
understate costs, and the relatively low overall tonnages collected through this
route, the figure chosen is not considered to overstate the benefits achieved in this
study.
Note that the figure given above includes revenue costs from the sale of material.
The collection only costs would be higher, but in this case the net figure is correct.
A.4.1.2 Household Waste Recycling Centres (HWRCs)
The costs of operating an HWRC vary considerably depending upon the setup of the
centre. Again we aim to estimate a single conservative figure for use in the cost
benefit analysis.
The incremental cost of recycling waste at HWRCs has been estimated at £70 per
tonne.
186
This figure includes staff costs, handling costs and additional capital costs
to handle the waste. However, we have assumed that there will only be minimal
changes in the HWRC infrastructure as a result of a decrease in beverage container
tonnages in comparison to the baseline situation. Therefore, there will be no savings
resulting from reduced capital expenditure; hence the avoided costs of recycling
would be lower than the figure given, and we have therefore used a lower figure of
£15 per tonne to represent savings in handling and staff time for a reduction in
containers deposited at HWRCs.
Handling costs for refuse at HWRCs will be low. We estimate these at £15 per tonne
of waste delivered to the centre. On the other hand, the cost of disposal of the refuse
(landfill gate fees and landfill tax) will comprise a significant proportion of the total
costs (see Appendix A.5.1.4).
Regarding disposal, we have assumed an avoided disposal cost of £100 per tonne
in this modelling. The justification is as follows:
1. From WRAP’s latest survey of gate fees, the median pre-tax gate fee for
landfilling reported by local authorities is around £23 per tonne. The landfill
tax will be at £80 per tonne in the period which we are modelling (from
2014). The tax rate is set in nominal terms and will be eroded somewhat by
the effects of inflation. The level of tax in real terms is expected to be of the
order £72.50 per tonne (we have assumed a 2.5% deflator). Hence, the costs
of landfilling are likely to be around £95.50 per tonne if the pre-tax gate fees
remain constant in real terms (and this has proven a relatively robust
assumption over the last 15 years).
2. At the same time, an increasing amount of residual waste will be sent to
treatments other than landfill. The gate fee for such treatments, at a scale of
around 200,000 tonnes, is currently of the order £90-£120 per tonne. These
figures have risen much faster than inflation, and are affected by a range of
factors, including (for equipment sourced from overseas) the exchange rate.
186
Eunomia (2010) Economics of Waste Management in London, Appendices to Final Report for GLA

156
3. The figure of £100 per tonne thus represents an estimate of the real costs of
disposal in 2014 and beyond, effectively ‘blending’ landfill and other residual
waste treatment costs. It should be noted that for some authorities with
treatment facilities built in the 1990s, the avoided costs of disposal will be
much lower than this. However, many of these will need to be retrofitted /
replaced over the coming decade, and the costs seem likely to increase
significantly as a result.
Hence the saving associated with a reduction of beverage containers deposited in
the refuse skip at HWRCs is estimated to be £115 per tonne. Due to the very low
quantities of containers being managed through this route, the cost benefit of the
system will not be sensitive to changes in this price.
A.4.1.3 Commercial Collection
The costs of collecting beverage containers from commercial premises, for recycling
or disposal, were taken from a study looking at the costs and benefits of landfill
bans in the UK.
187
The general principles being a) metals and plastics are likely to be
collected together (as separation costs are low), b) glass is collected separately and
c) the same cost of refuse collection applies to all material streams.
The costs of waste collection were derived using a simple cost model, which
included the following elements:
¾ Vehicle capital and operating costs;
¾ Driver / crew costs;
¾ Estimated number of pickups per day;
¾ Revenues from the sale of materials; and
¾ Sorting costs (where applicable).
The resulting costs of collection (and therefore savings avoided with a reduction in
the demand for collection services) are as follows:
¾ Plastics and metals - £136 per tonne;
¾ Glass - £41 per tonne; and
¾ Refuse - £35 per tonne.
The costs associated with commercial refuse collections are included here because,
in diverting additional material out of the refuse waste stream and into the deposit
system, there will be a saving due to the reduction in demand for the refuse service.
In addition to the reduction in costs of collecting commercial refuse, there will also
be a further saving associated with the reduction in ‘disposal’ or ‘recovery’ costs. It
was argued in Appendix A.4.1.2 that this cost is around £100 per tonne. Therefore,
this saving is also included for each tonne of commercial refuse waste that is
diverted into the deposit refund system.
187
Eunomia (2010) Landfill Bans Feasibility Research, Final Report for WRAP, March 2010,
http://www.wrap.org.uk/downloads/FINAL_Landfill_Bans_Feasibility_Research.f5cf24f9.8796.pdf

157
A.4.1.4 Litter / Street Sweepings
There is little information about the composition of and collection costs for
managing waste deposited in litter bins or collected by street sweeping. In general,
however, the costs are high, especially for street sweeping services.
The figures extracted from WasteDataFlow provide an estimation of the total
quantity of waste collected via both routes. For this study, we have estimated that
where litter is concerned, 80% of beverage containers are placed in litter bins, with
the remaining 20% being thrown onto the street and later being picked up by local
authority contractors or being left as uncollected litter. It should be noted that waste
collected via street sweeping is significantly more costly than that collected via litter
bins.
A small literature review was conducted by Eunomia on behalf of the GLA regarding
costs of street sweeping.
188
The data available was found to be very limited - mainly
as local authorities do not want to share details of contract prices. Based on this
limited research, we estimate the savings from avoided street sweeping could be as
high as £1,500 per tonne, and for collection from litter bins (or on-the-go recycling
bins), around £200 per tonne of avoided waste.
It could be argued that some of the savings on collection posited in the central case
might not, in fact, materialise. Street sweepers still need to sweep streets because
the non-deposit litter still persists, and has to be collected. The counter argument
would be that there are savings on time (and volume, though the significance of this
depends on the method of collection) and that the collection savings would be made
in the manner suggested. Indeed, a reduced level of littering associated with highly
visible items such as beverage packaging may have the effect of suppressing
littering with other items (on the basis that litter tends to beget more of the same).
We have therefore modelled a conservative 20% saving on the collection, but have
credited all the savings associated with the reduction in disposal.
188
Eunomia (2010) Economics of Waste Management in London, Appendices to Final Report for GLA

158
A.5.0 Environmental Impacts
Environmental impacts associated with the introduction of a deposit refund system
will occur from the following processes:
1) Recycling of beverage containers;
2) Disposal of beverage containers;
3) Collection and transportation of containers to recyclers’ and
4) Disamenity associated with litter.
Each of these processes is described in further detail in the Sections below.
The two main elements considered for processes 1) to 3) are greenhouse gas (GHG)
emissions and air quality impacts. The approach to valuing these two elements is
set out in Appendix A.5.1.1 and Appendix A.5.1.2. However, there is also an
environmental impact to be considered. This is related to the disamenity associated
with litter. There is a dearth of relevant studies allowing the valuation of this, but it is
simply too important, in our view, to be assigned (implicitly) a zero value. Our
approach is set out in Appendix A.5.1.6.
A.5.1.1 Greenhouse Gas (GHG) Valuation
The approach detailed in the latest guidance from the Department of Energy and
Climate Change (DECC) on the valuation of carbon in policy appraisal forms the
basis of the valuation of GHG-related impacts.
189
The approach is the same used in
the cost benefit analysis of landfill bans undertaken by Eunomia; full details of the
calculations used can be found in the appendices of the document.
190
Under the DECC approach, the precise valuation methodology differs according to
the specific policy question being addressed:
¾ For appraising policies that reduce/increase emissions in sectors covered by
the EU Emissions Trading System (ETS), and in the future other trading
schemes, a ‘traded price of carbon’ will be used. This will be based on
estimates of the future price of EU Allowances (EUAs) and, in the longer term,
estimates of future global carbon market prices;
¾ For appraising policies that reduce/increase emissions in sectors not covered
by the EU ETS (the’ non-Traded Sector’), the ‘non-traded price of carbon’ will
be used, based on estimates of the marginal abatement cost (MAC) required
to meet a specific emission reduction target;
189
DECC (2009) Carbon Valuation in UK Policy Appraisal: A Revised Approach. Climate Change
Economics, Department of Energy and Climate Change, July 2009.
190
Eunomia (2010) Landfill Bans Feasibility Research, Final Report for WRAP, March 2010,
http://www.wrap.org.uk/downloads/FINAL_Landfill_Bans_Feasibility_Research.f5cf24f9.8796.pdf

159
¾ In the longer term (2030 onwards), consistent with the development of a
more comprehensive global carbon market, the traded and non-traded prices
of carbon converge into a single traded price of carbon.
The value of carbon is deemed to vary over time. For recycling, where both recycling
and the manufacture of containers using virgin materials are assumed to occur
overseas, the emissions savings will be valued at the Shadow Price of Carbon (SPC),
although for modelling purposes, from 2020 to 2030 the SPC prices would be
amended, converging linearly with the traded price.
191
Given that the benefits associated with GHG emissions reduction are posited to
increase in the future, the year in which the modelling is set will affect the overall
monetised value of emissions. Ideally we would model waste flows over time, apply
the correct value year-by-year, and calculate the net present value of the total
benefits. Given that the study is forward looking, it seems sensible to choose a year,
not too close, but not too far ahead. The values for 2020 have thus been used in the
calculation of greenhouse gas associated damage costs.
A.5.1.2 Air Quality Valuation
We have considered the impacts upon air quality that are expected to result from
the treatment processes, including both direct and indirect impacts (the latter
relating to avoided impacts associated with energy generation and the recycling of
materials).
Our approach is to apply external damage costs to emissions of a range of air
pollutants, allowing for the quantification of impacts in monetary terms.
The analysis that follows is focussed upon emissions to air. Whilst waste treatment
processes may also in some cases affect soil and water quality, data regarding the
precise nature of these impacts is less robust, and valuation data is more scarce
still.
Two sets of damage costs were initially considered for this study, based on the cost
benefit analysis of landfill bans undertaken by Eunomia, and with full details again
provided in the Appendices of this document.
192
In summary, the two sets of
damage costs considered were:
¾ The first set is from the UK Government’s Interdepartmental Group on Costs
& Benefits (IGCB) Guidance on Air Quality Damage Costs. This covers damage
costs for particulate matter (PM10), oxides of nitrogen (NOx), sulphur dioxide
(SO2) and ammonia (NH3). Emission damage costs are broken down by
sector and, for transport emissions, by location;
191
The IPCC approach considers GHG emissions only insofar as they affect the UK’s inventory as
reported to the IPPC. In this case, any increase or reduction in GHG emissions overseas as a result of
UK waste management is ignored. Under the Global approach, all emissions would be considered,
irrespective of the location of their generation.
192
Eunomia (2010) Landfill Bans Feasibility Research, Final Report for WRAP, March 2010,
http://www.wrap.org.uk/downloads/FINAL_Landfill_Bans_Feasibility_Research.f5cf24f9.8796.pdf

160
¾ The second set, covering a wider range of pollutants, uses UK-specific
damage costs for non-GHGs taken from the Clean Air for Europe (CAFÉ)
programme, and the Benefits Table (BeTa) database. The figures are given in
Euros in year 2000 prices, so they are converted to £ and inflated to 2009
prices. Damage costs for carbon monoxide are taken from a Danish study.
The ‘medium high’ dataset has been used for valuing impacts.
However, ongoing work around the valuation of air emissions under the IGCB
dataset (currently being undertaken by Eunomia) is showing that these figures are
underestimates of the likely damages associated with air emissions. Taking the
precautionary approach, the Café data set, has been used as these are generally
higher than the IGCB figures – the medium low values were used for this study.
A.5.1.3 Recycling of Beverage Containers
A significant quantity of recycling is already taking place, as presented in the
baseline in Appendix A.2.2. The aim of this study is not to value the material that is
already being collected for recycling, but to establish the value of the additional
recycling that will occur as a result of higher return rates from the parallel and
complementary deposit refund systems. Recovery rates for the baseline and the two
scenarios are shown in Table A-34.
Table A-34: Recovery Rates and Additional Material Recycled (thousand tonnes)
Recovery Rate Additional Material Recycled
(thousand tonnes)
Products
Baseline Complementar
y
Parallel
Complementary Parallel
Glass
Bottles
77% 95%
95%
425 420
PET Bottles 29% 93%
90%
200 192
Cans (Fe.) 43% 94%
92%
102 98
Cans (Al.) 37% 92%
89%
68 64
Total 68% 95%
94%
795 773
Source: Eunomia
Emissions factors for recyclates were taken from the Landfill Bans study.
193
Under
the approach to valuing GHGs (see above) a different value is used depending on
whether the emissions are saved in the UK, or abroad. For this model, it is assumed
that 50% of the recycling of each material would occur in the UK and 50% overseas.
193
Eunomia (2010) Landfill Bans Feasibility Research, Final Report for WRAP, March 2010,
http://www.wrap.org.uk/downloads/FINAL_Landfill_Bans_Feasibility_Research.f5cf24f9.8796.pdf

161
Therefore, half of the GHG emissions are valued at the non-traded price, and half at
the shadow price of carbon.
Air quality impacts are calculated using the values discussed in the section above;
however, it is recognised that emissions may attract a lower value in countries
where recycling activities take place. The GHG and air quality impacts are given per
tonne of material recycled in Table A-35.
Table A-35: Recycling Impacts for GHGs and Air Emissions, per tonne
Material GHGs Air Quality
Glass -£13
-£10
Ferrous metal -£62
-£53
Non ferrous metal -£430
-£333
Dense plastics -£64
-£51
Source: Eunomia (2010) Landfill Bans Feasibility Research (AQ – Café only)
From the assumptions laid out above, the total monetised benefit of the additional
recycling generated from introducing a deposit refund system is calculated as £88
million and £84 million for the complementary and parallel systems respectively.
A.5.1.4 Disposal of Beverage Containers
The total change in tonnages requiring disposal was calculated when determining
the scenario waste flows (see Appendix A.2.3.3).
For the potential savings associated with reduction in containers going to landfill, it
is important to determine whether the potential environmental benefit calculated
via the above means (GHGs and air quality) is less than or greater than the actual
financial benefit associated with a reduction in landfill tax.
The landfill tax is applied as a means to internalise the externalities associated with
landfilling waste ie. it accounts for environmental benefits as a ‘private’ cost. Given
that, in this instance, the landfill tax is greater than the calculated environmental
benefits associated with a reduction in containers going to landfill, the landfill tax
has subsequently been used to calculate the benefit associated with avoided
landfill, as detailed in Appendix A.4.0.
Similarly, we have not included damage costs associated with disamenity of waste
treatment facilities, as estimates of disamenity costs vary considerably between the
different sources, and are not yet available for processes other than incineration and
landfill.
Excluding the savings that are associated with avoided payment of landfill tax, which
have already been discussed in Appendix A.4.0, the only other environmental benefit
would occur if containers are displaced from other forms of residual treatment. In
this model it is assumed that 25% of the UK’s waste is managed though thermal
facilities in the future. We therefore use the figures for energy from waste (EfW)
calculated in the landfill bans study as unit impacts for GHGs and Air Quality. The

162
approach to valuing these impacts is described in detail in the appendices for this
report.
184
The total monetised benefit of containers being diverted from disposal is thus
calculated at around £6 million for both scenarios.
A.5.1.5 Collection of Beverage Containers
Beverage containers are collected and transported large distances to reach
reprocessing facilities using trucks and lorries. These vehicles emit greenhouse
gases, and a number of other compounds and particles, which cause damage to the
environment. It is important to include these impacts in the cost benefit analysis.
However, it is also important to include the avoided transportation from a reduction
in waste collected at the kerbside or from commercial premises.
Table A-36 thus shows the estimated distance travelled for the various elements of
the overall modelling, including changes to the kerbside collection system and the
direct impact of the introduction of specific beverage-container collection rounds for
both scenarios.
Table A-36: Distance Travelled in Collecting Containers, thousand km
Miles Driven Transportation Requirement
Parallel
Complementary
Household - Recycling
-4,293
-4,890
Household - Refuse
-1,302
-1,332
Commercial - Recycling
-1,838
-1,932
Commercial - Refuse
-889
-935
Street Collections
-233
-245
HWRCs
-184
-193
Bring Site
-646
-679
Backhauling
0
0
Collection Rounds
132,490
132,490
Additional Consumer Journeys
286,000
286,000
Net Change
409,104
408,284

163
Source: Eunomia
Using the Euro 5 emissions limits for HGVs and Café air quality damage costs, the
total environmental damages from the increase in vehicles collecting waste is
estimated at around £25 million for both scenarios.
194
If the Euro 6 emissions limits
are used (those to be in place for new vehicles by 2014), the damages fall to around
£9 million.
A.5.1.6 Disamenity of Uncollected Litter
There is a negative environmental impact, or disamenity, associated with
uncollected litter. A study by Cambridge Economic Associates indicates that the
average household would be willing to pay £25 per annum to live in a
neighbourhood where the streets are kept clean.
195
Unfortunately, however, this
value does not cover the potential willingness to pay to remove litter from rural
areas, and, as far as we are aware, there are no studies attempting to place a value
on the disamenity experienced in such circumstances in the UK.
The only significant study of this nature of which we are aware was carried out in
Australia by Pricewaterhouse Coopers. This indicated that households are willing to
pay, on average, AUS $4.15 per 1% reduction in litter. The quantification of
‘reduction’ is not clear, but if, in line with the work of Stein and Syrek, we take the
view that size (volume) is a proxy for visual impact, and that visual impact is what
residents most notice, then we might assume that households interpreted this in
terms of volume reduction.
196
Assuming this to be the case, then if one also assumes:
• Beverage cans occupying 25% by volume of litter (which may be
conservative);
197
and
• 80% reduction in beverage-related litter as a result of a DRS
198
then the effective reduction in litter volume would be equivalent to 20% of the total.
Using the Pricewaterhouse Coopers figures, converted to UK exchange rates (we
194
http://europa.eu/legislation_summaries/environment/air_pollution/l28186_en.htm
195
Cambridge Economic Associates et al (2010) Developmental Work to Value the Impact of
Regeneration, Technical Report: Environmental Quality and Amenity, May 2010
196
Steven Stein and Daniel Syrek (2005) New Jersey Litter Survey: 2004, A Baseline Survey of Litter
at 94 Street and Highway Locations, Report for the New Jersey Clean Communities Council, January
28, 2005. http://www.njclean.org/2004-New-Jersey-Litter-Report.pdf
197
The analysis in Section 4.2 above suggests that the effect of DRSs on the volume reduction in
litter in the US may be well above this figure, and in systems which are achieving lower return rates
than the one modelled here. In addition, the analysis of the composition of litter in the UK is at least
suggestive of a relatively high proportion of the volume being occupied by beverage containers.
198
These figures are typical of the levels of reduction reported under DRSs for beverage containers
(see, for example, Perchards (2005) Deposit Return Systems for Packaging Applying International
Experience to the UK, Peer Review of a Study by Oakdene Hollins Ltd., Report to Defra 14 March
2005).
164
have used the rate UK£ 1 = AUS $1.73), the value of this would be £48 per
household.
This gives a net figure, across 26 million households in the UK, of £1,248 million per
annum.
